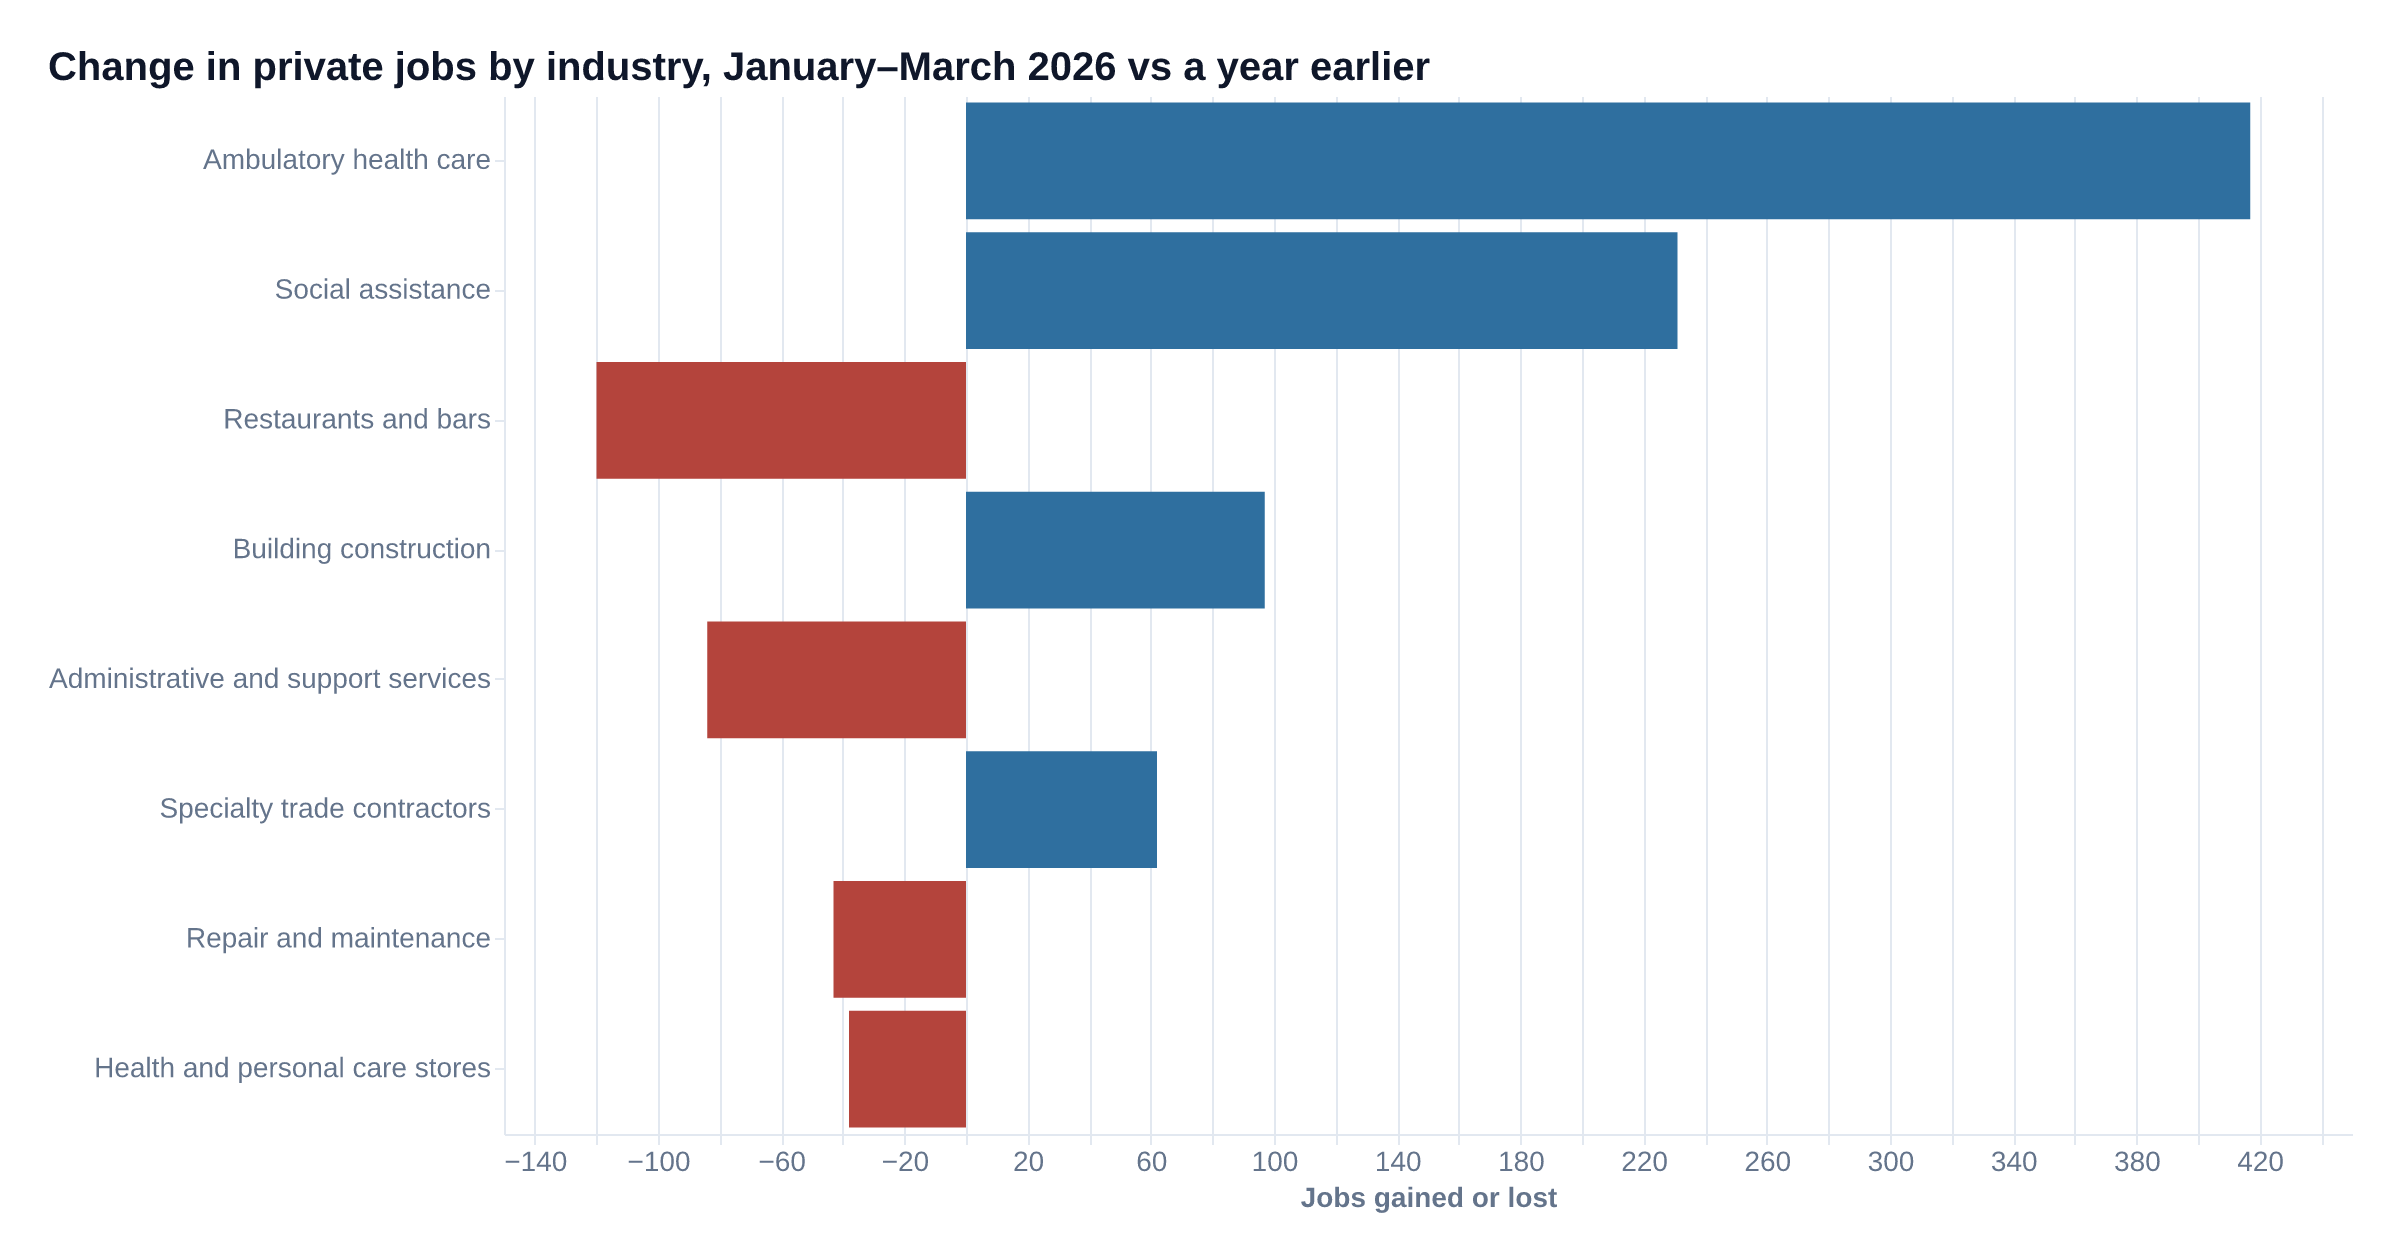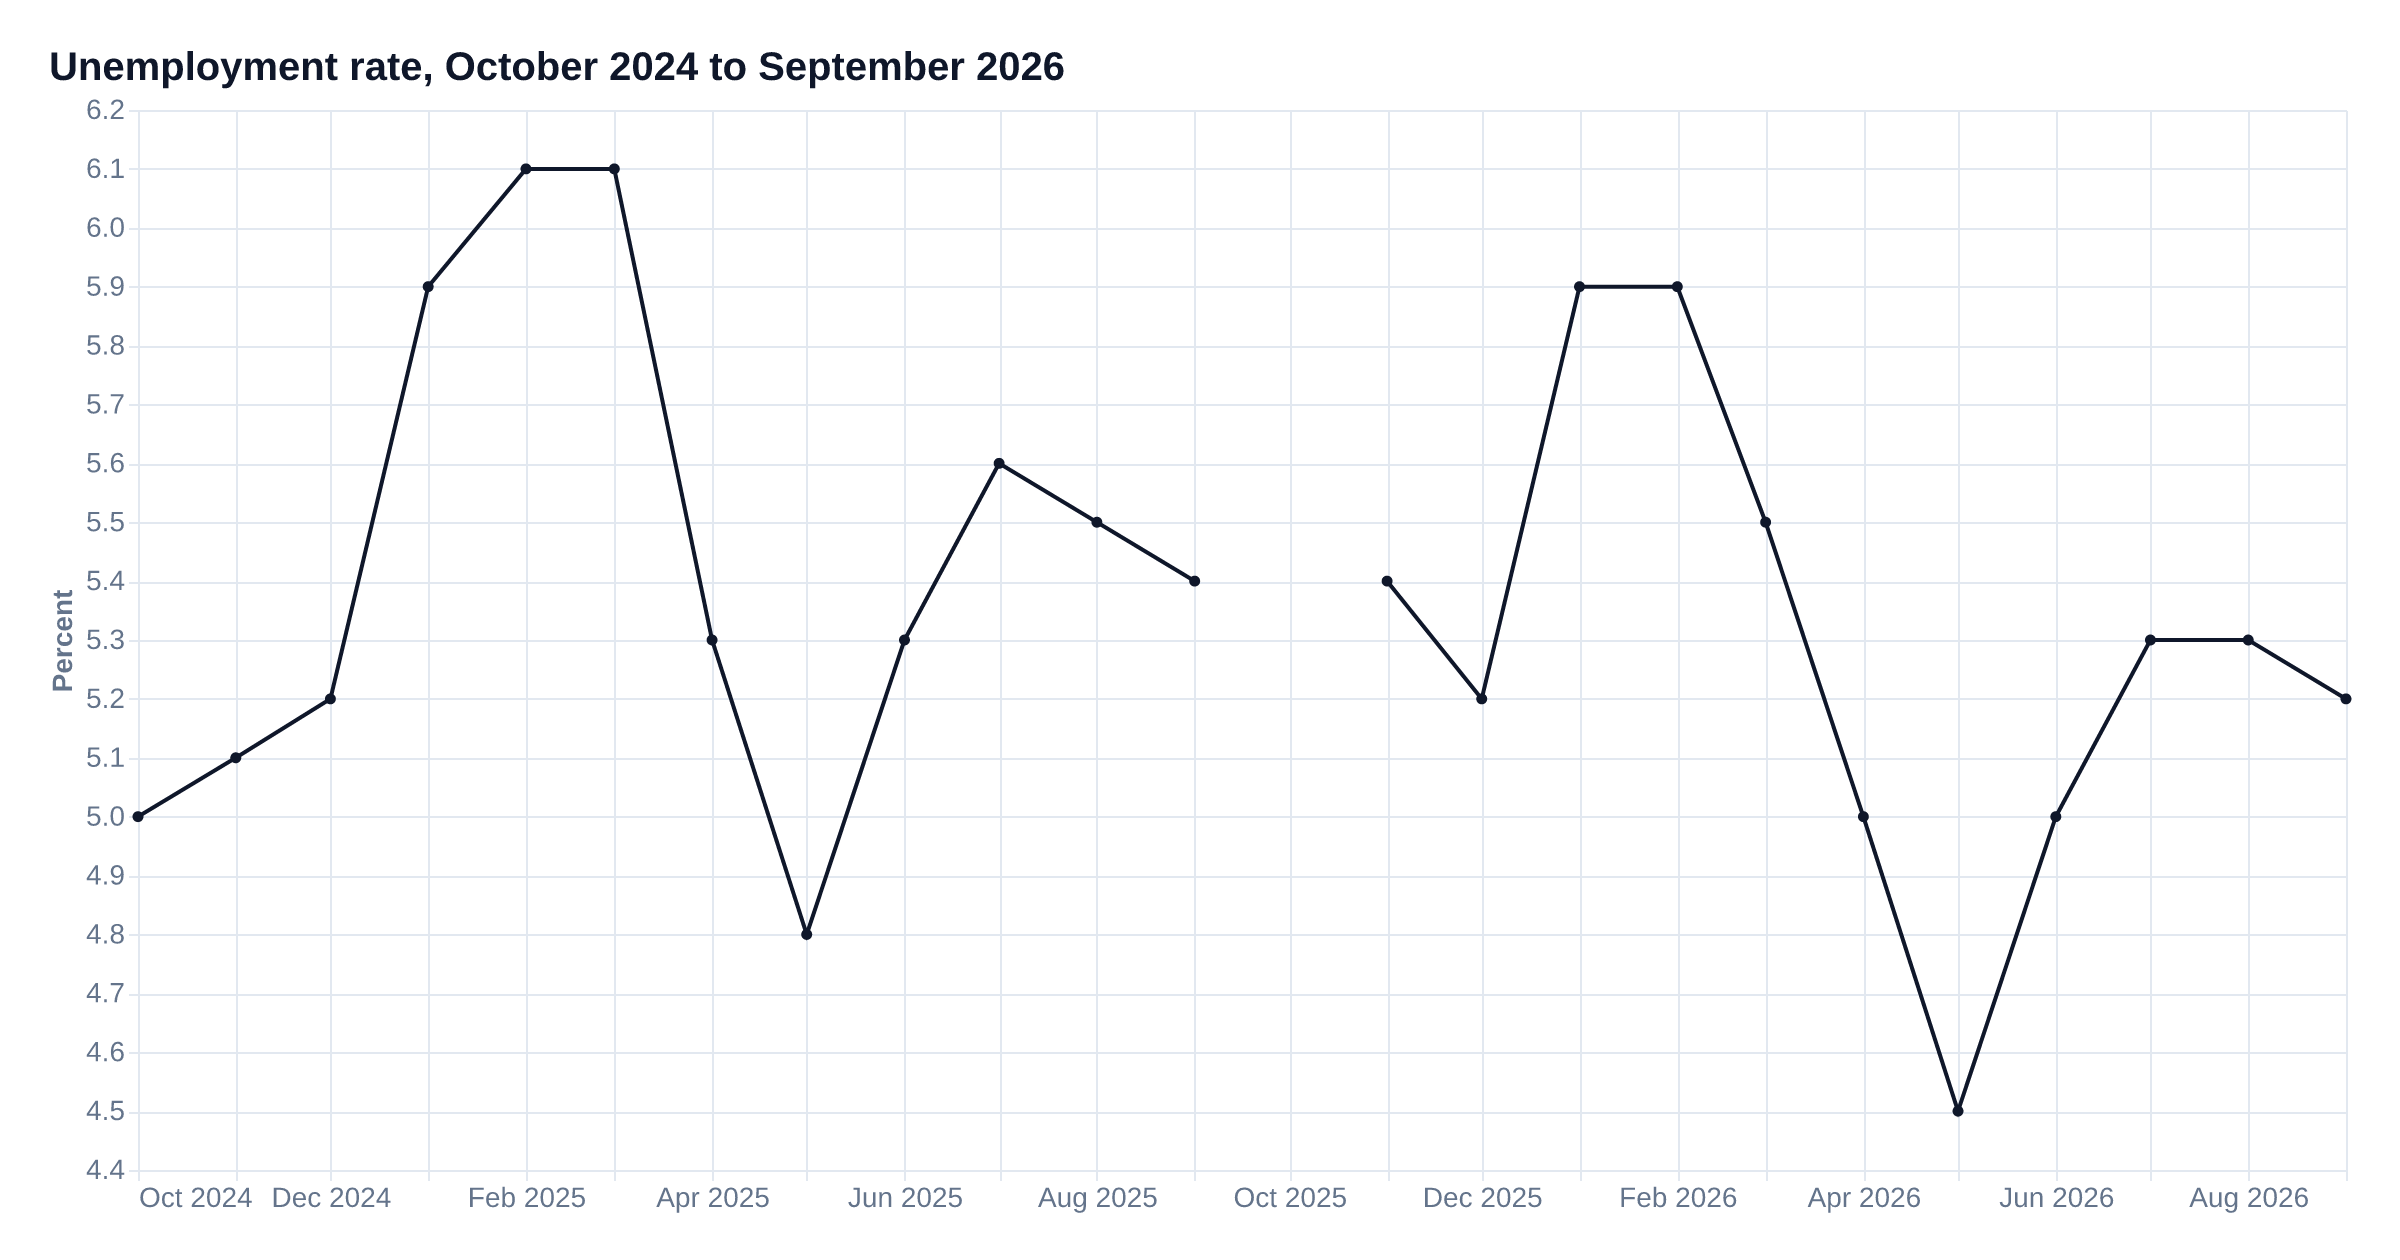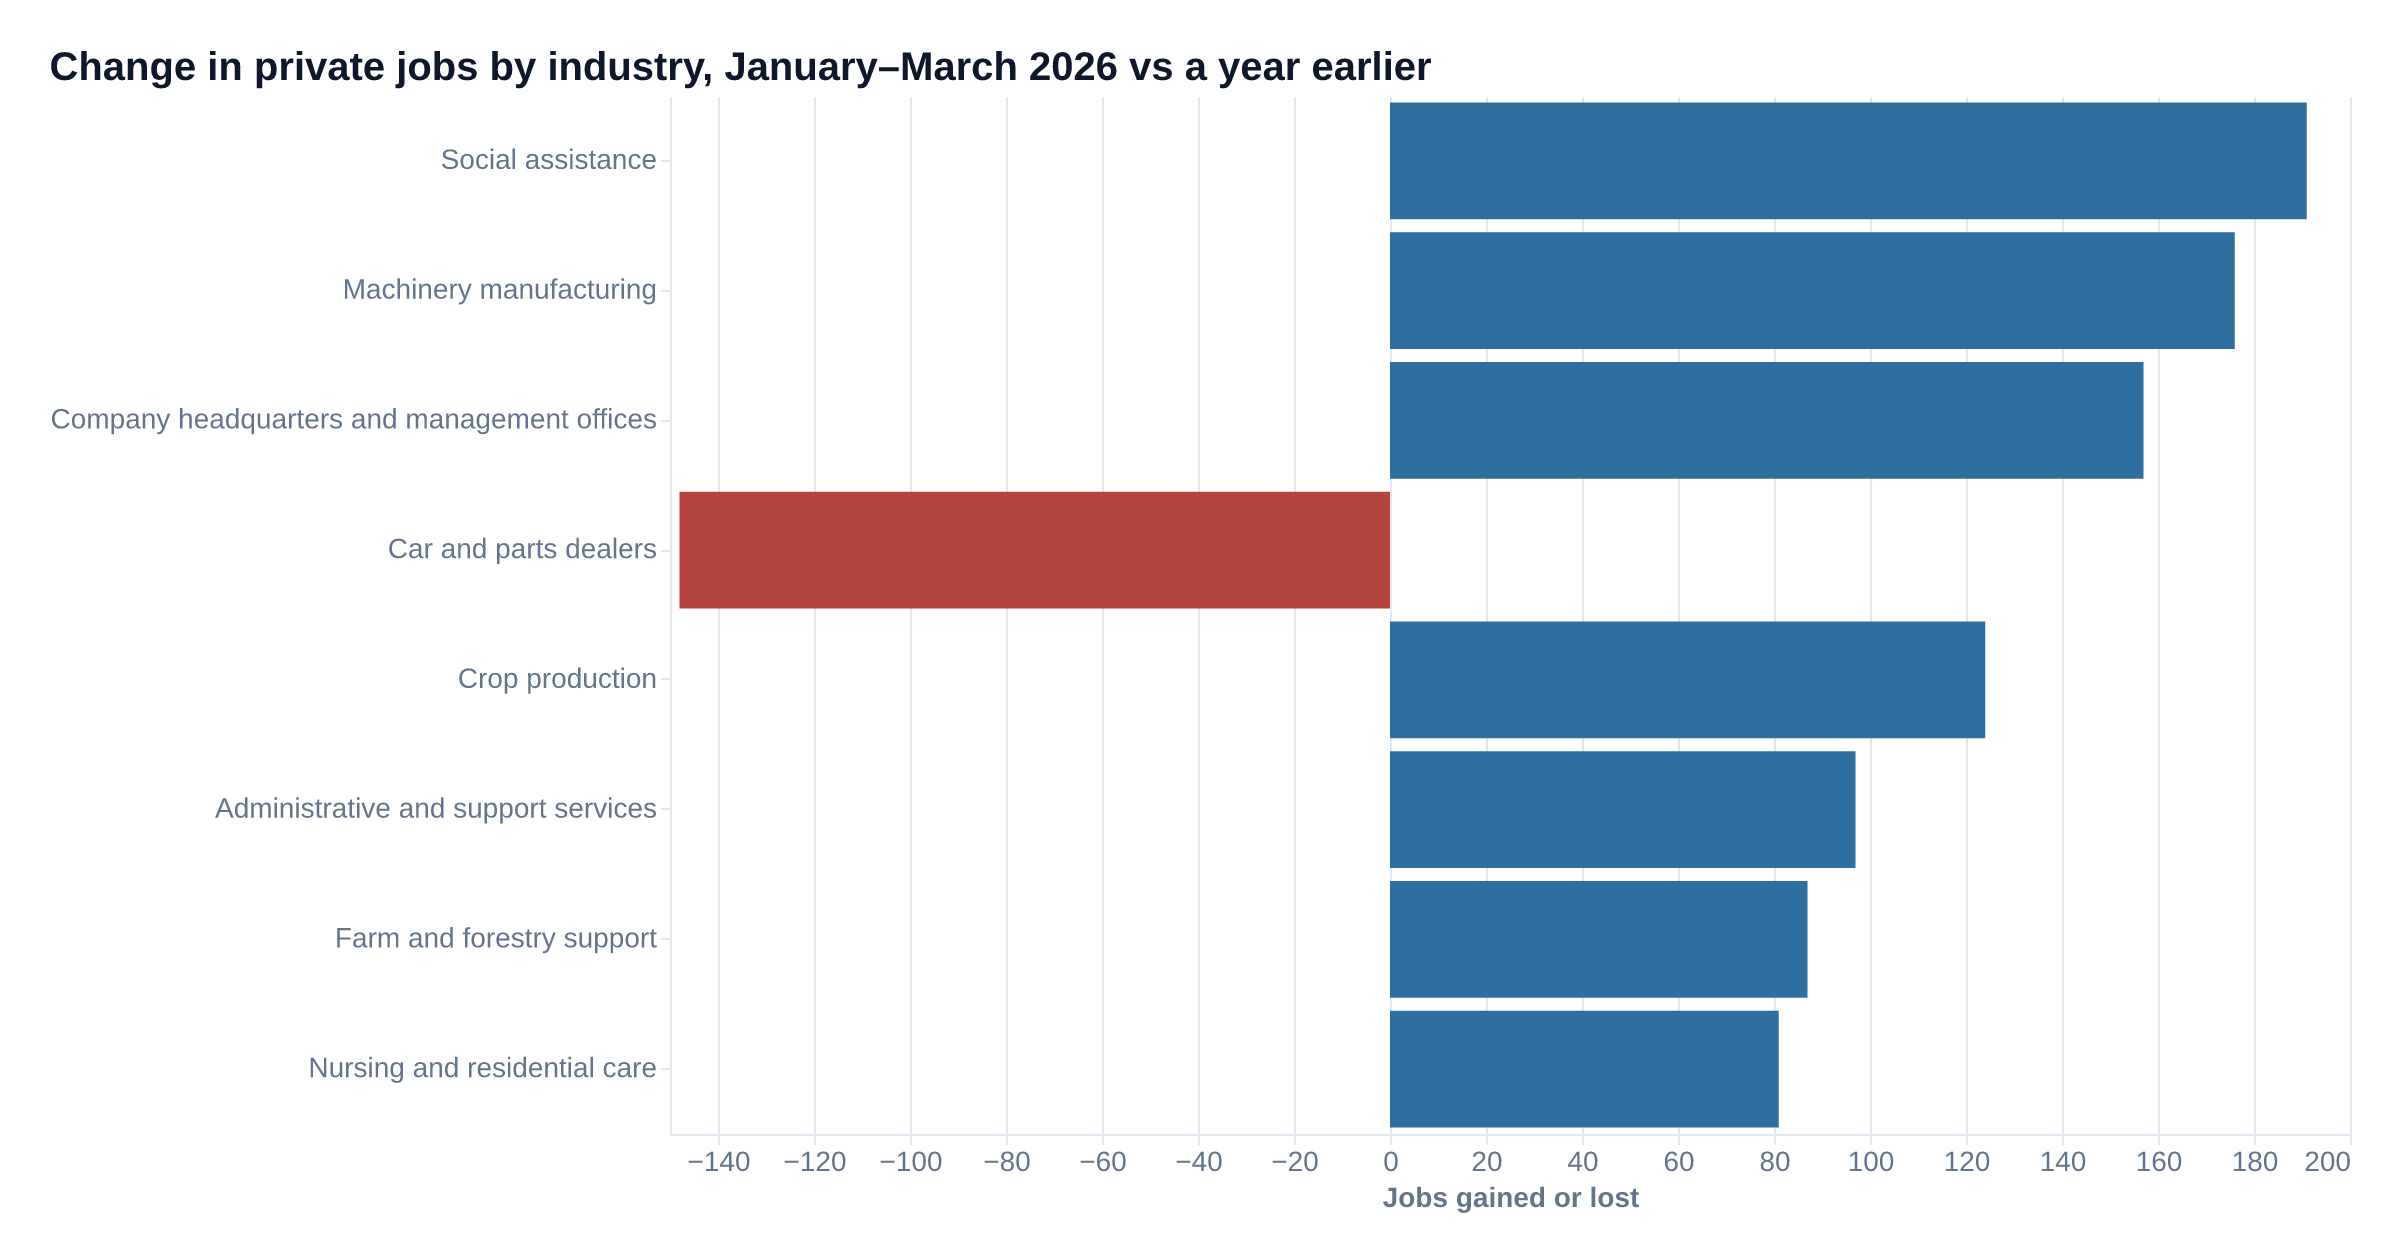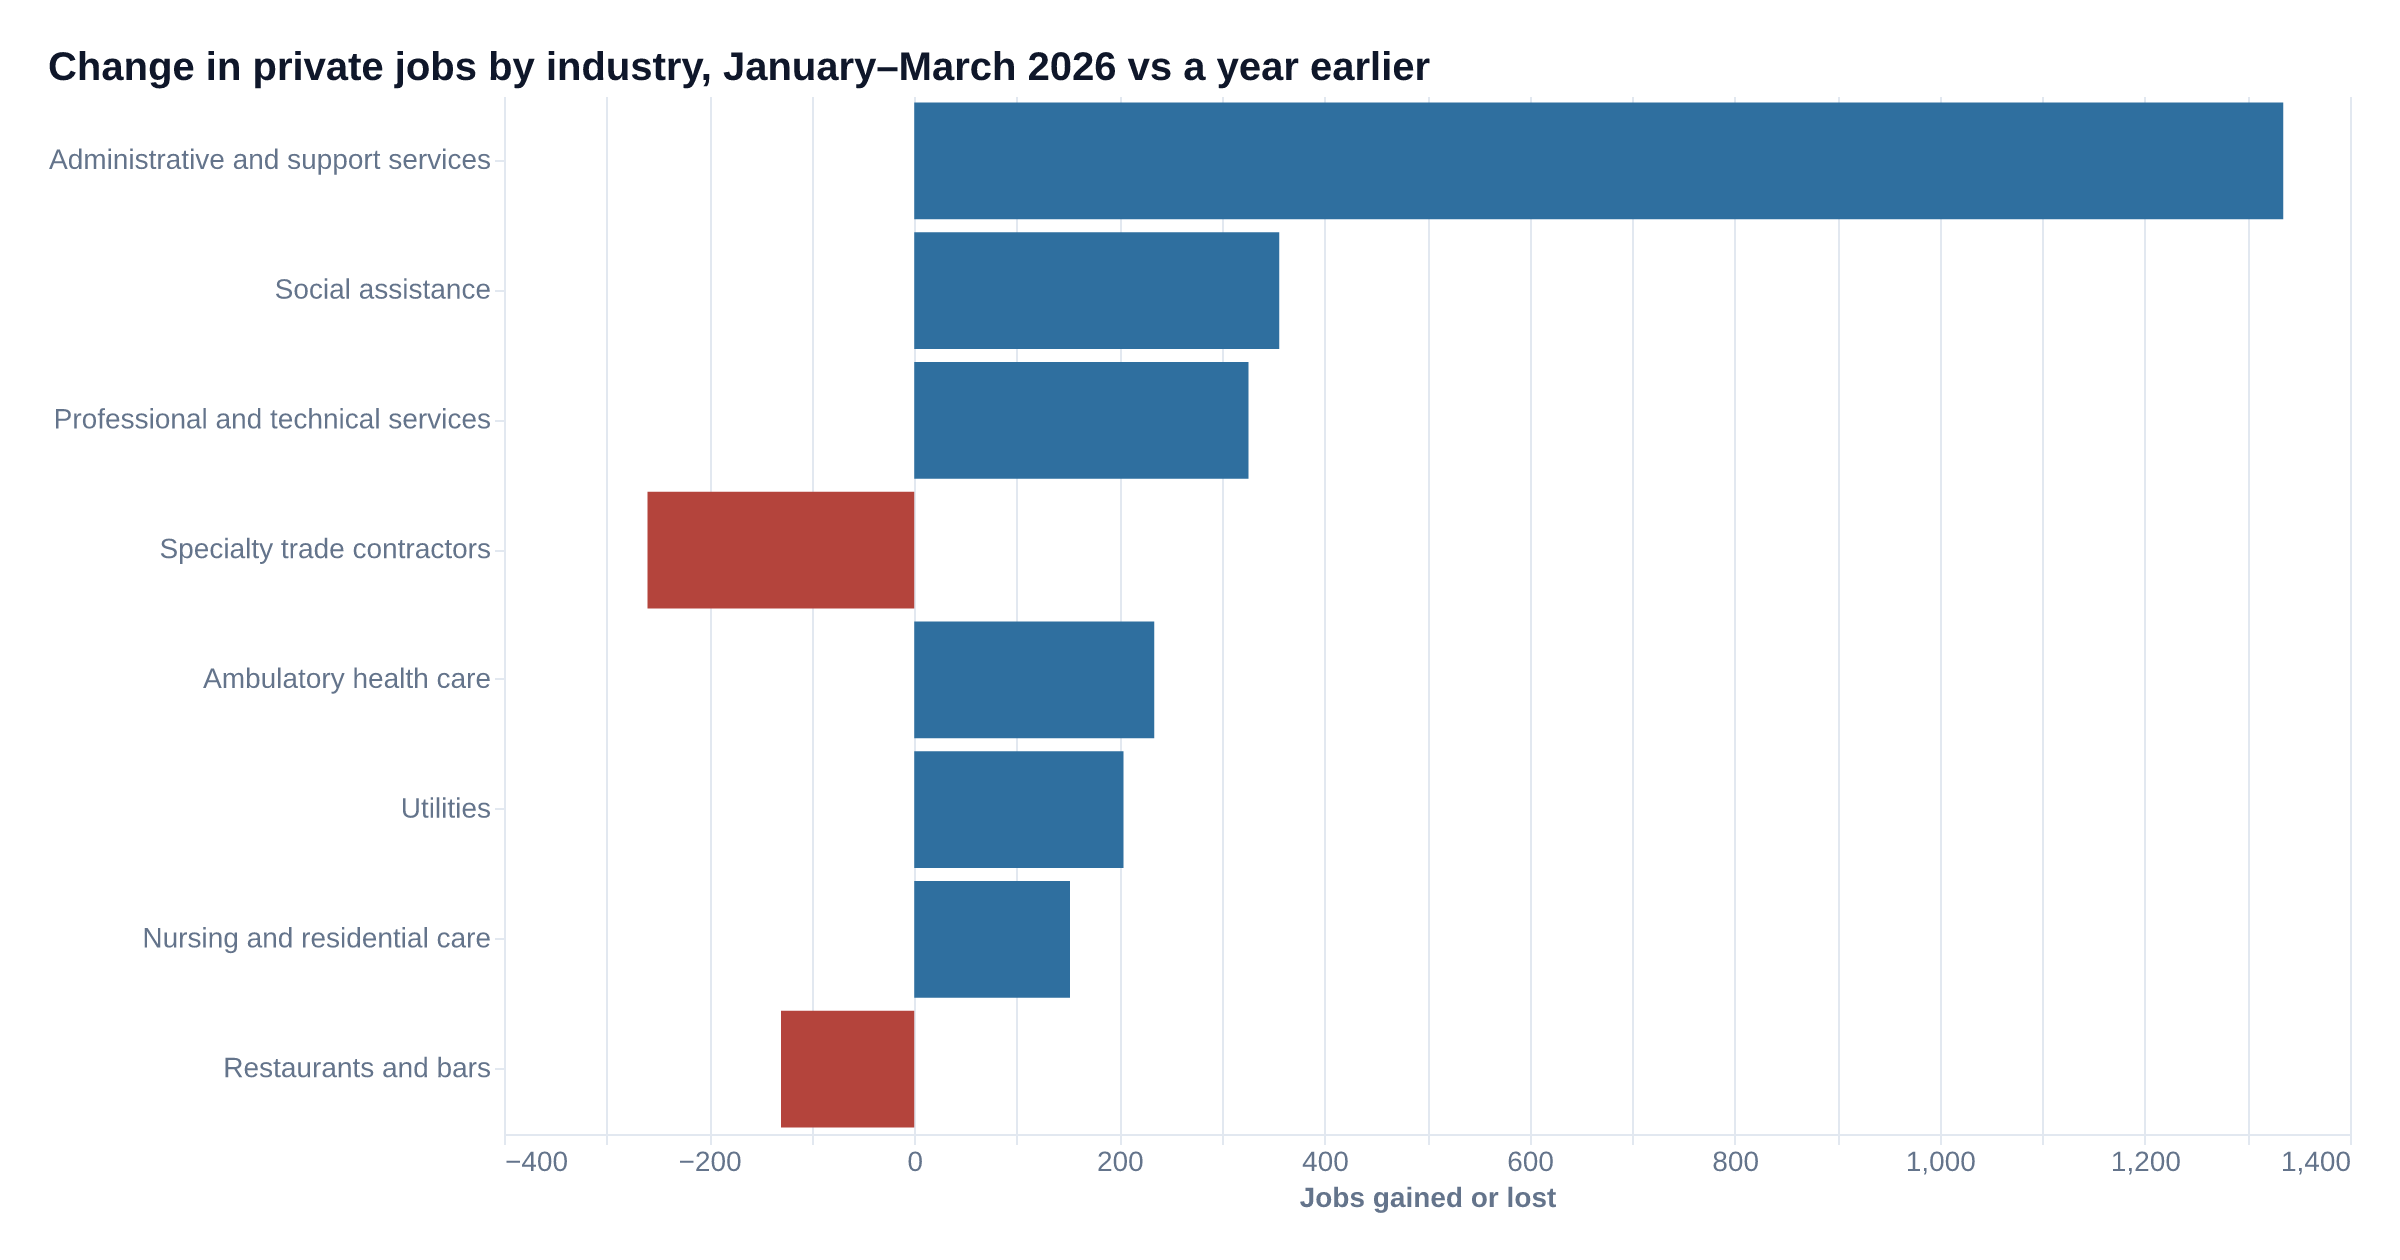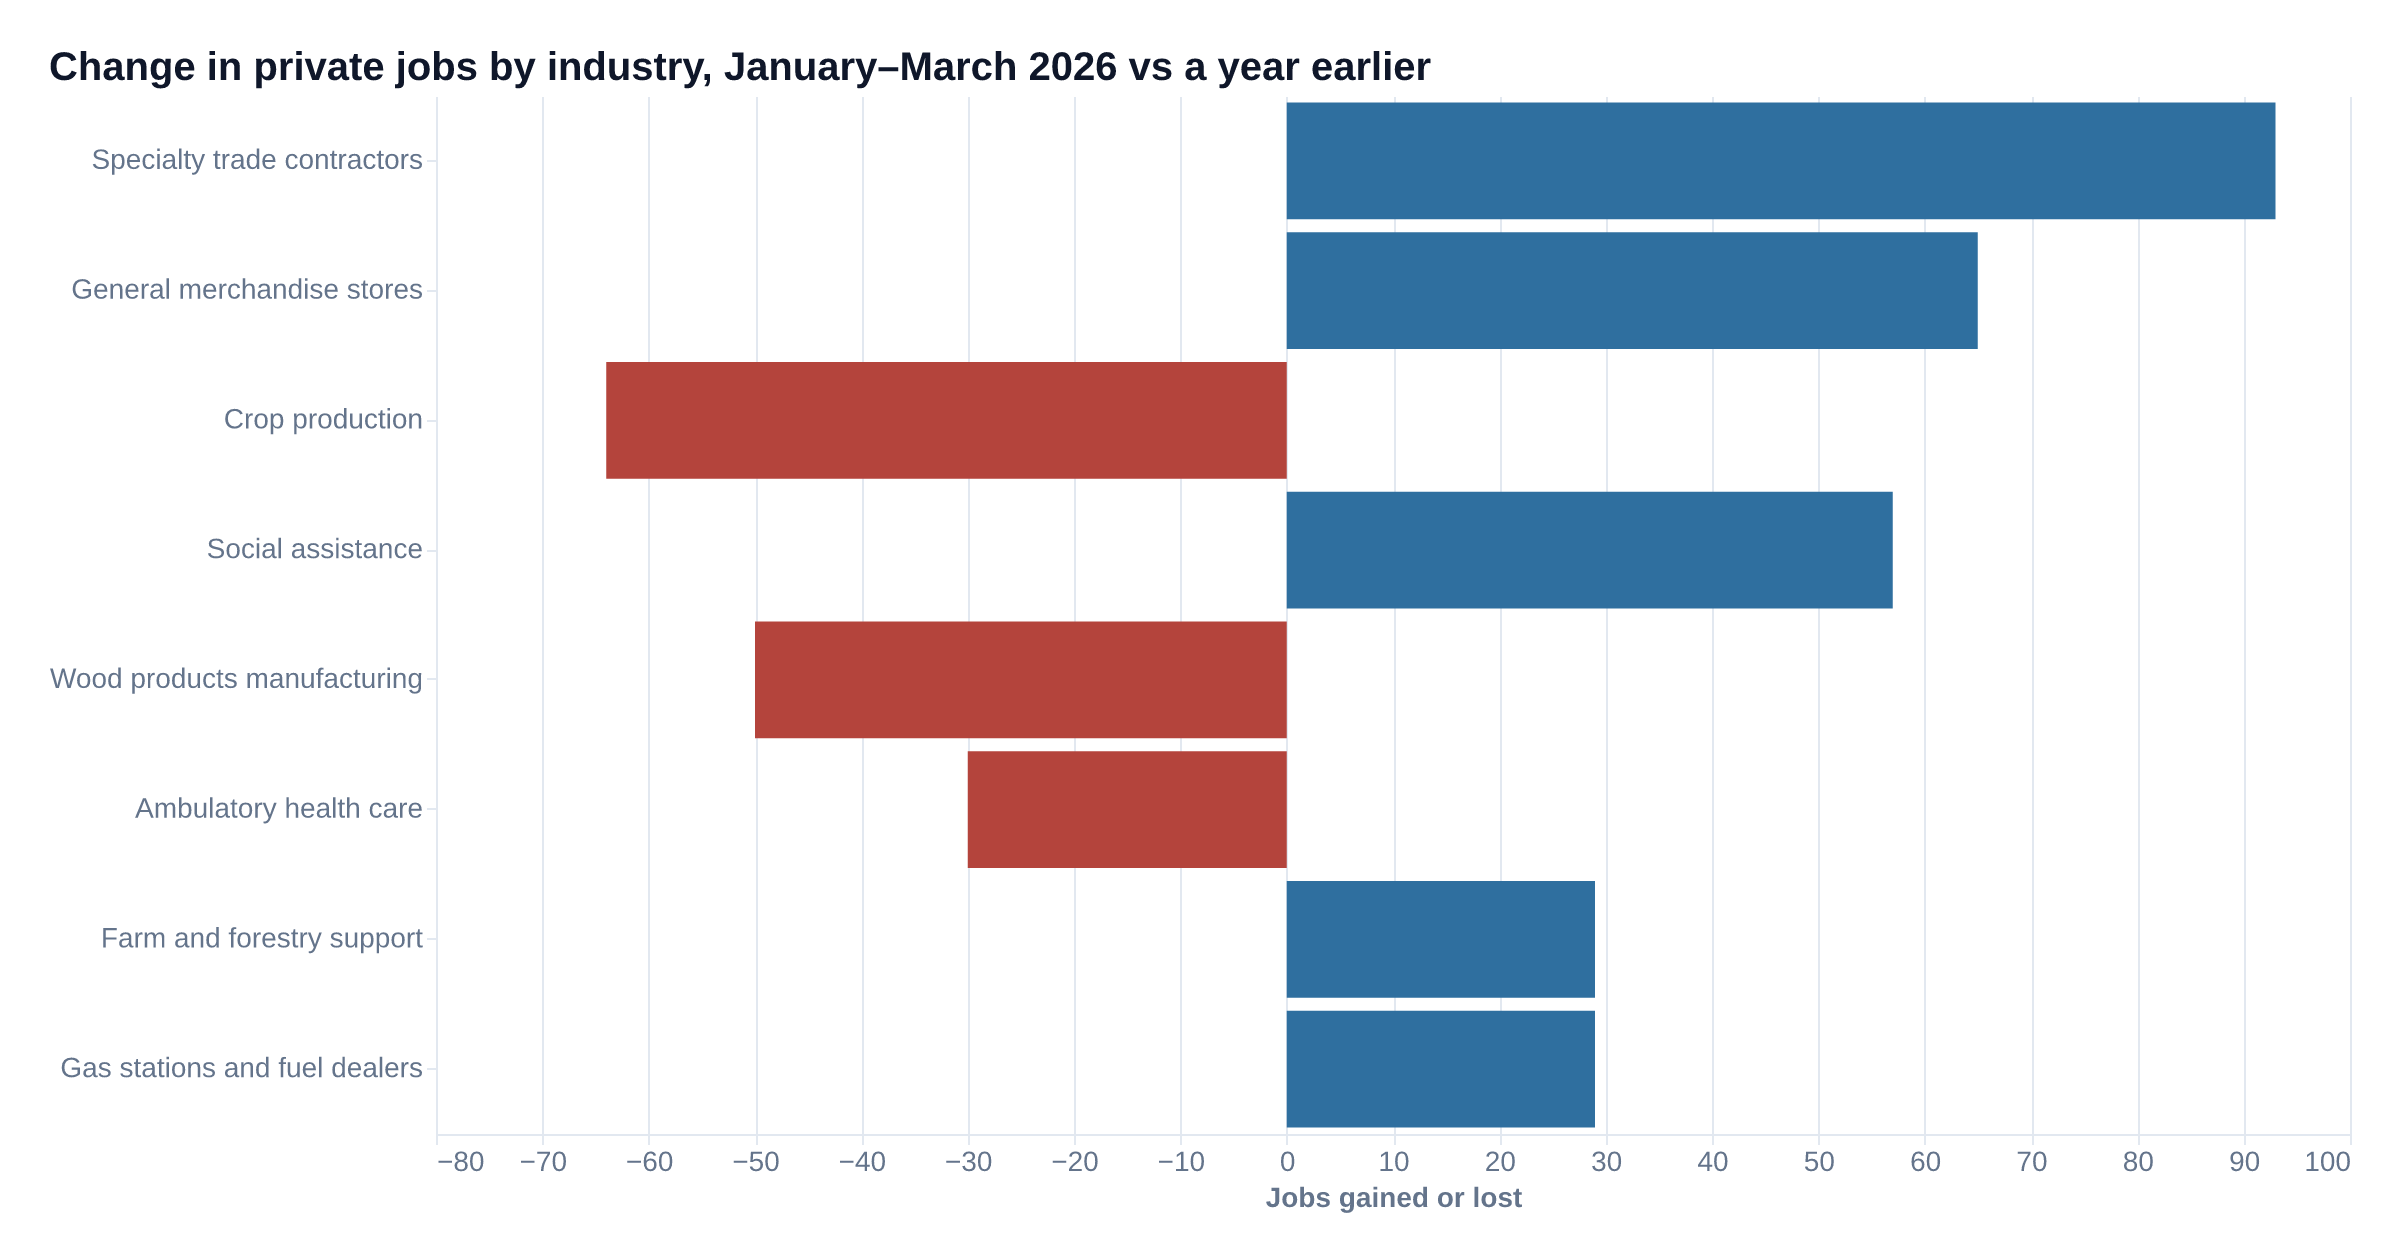
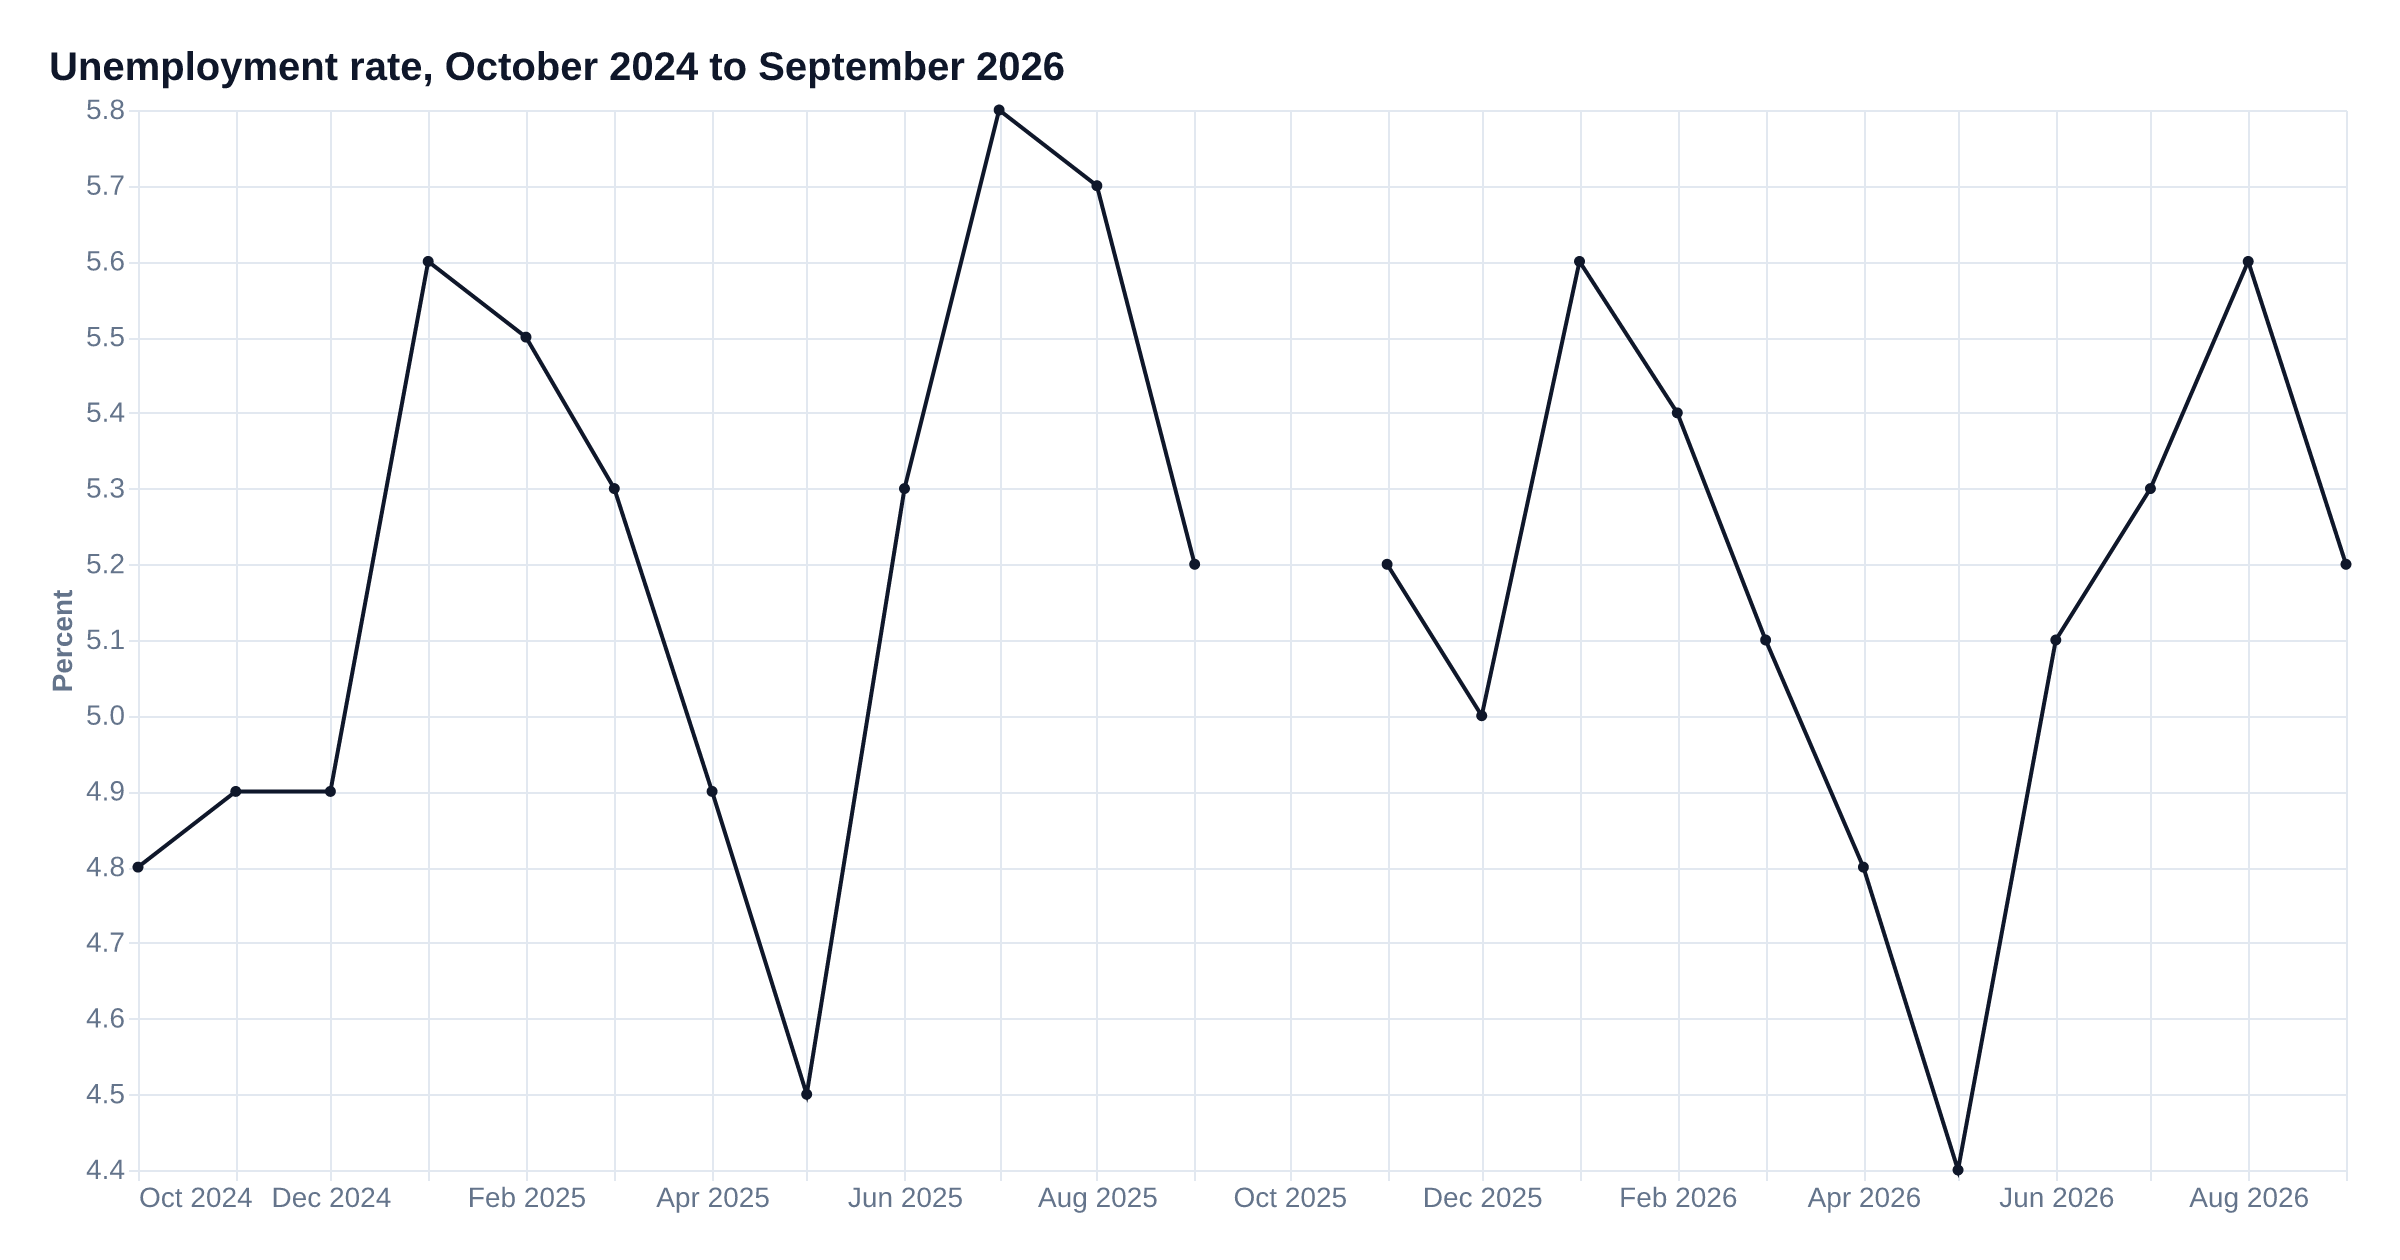
The unemployment rate in Humboldt County, the share of the labor force (people working or looking for work) who were unemployed, was 5.2% in September 2026, the same as in September 2025. 60,300 people were working or looking for work, 1,100 fewer than a year earlier. The September 2026 figures are preliminary; the state revises them the following month, and the comparisons here are redone with the revised figures.
In context
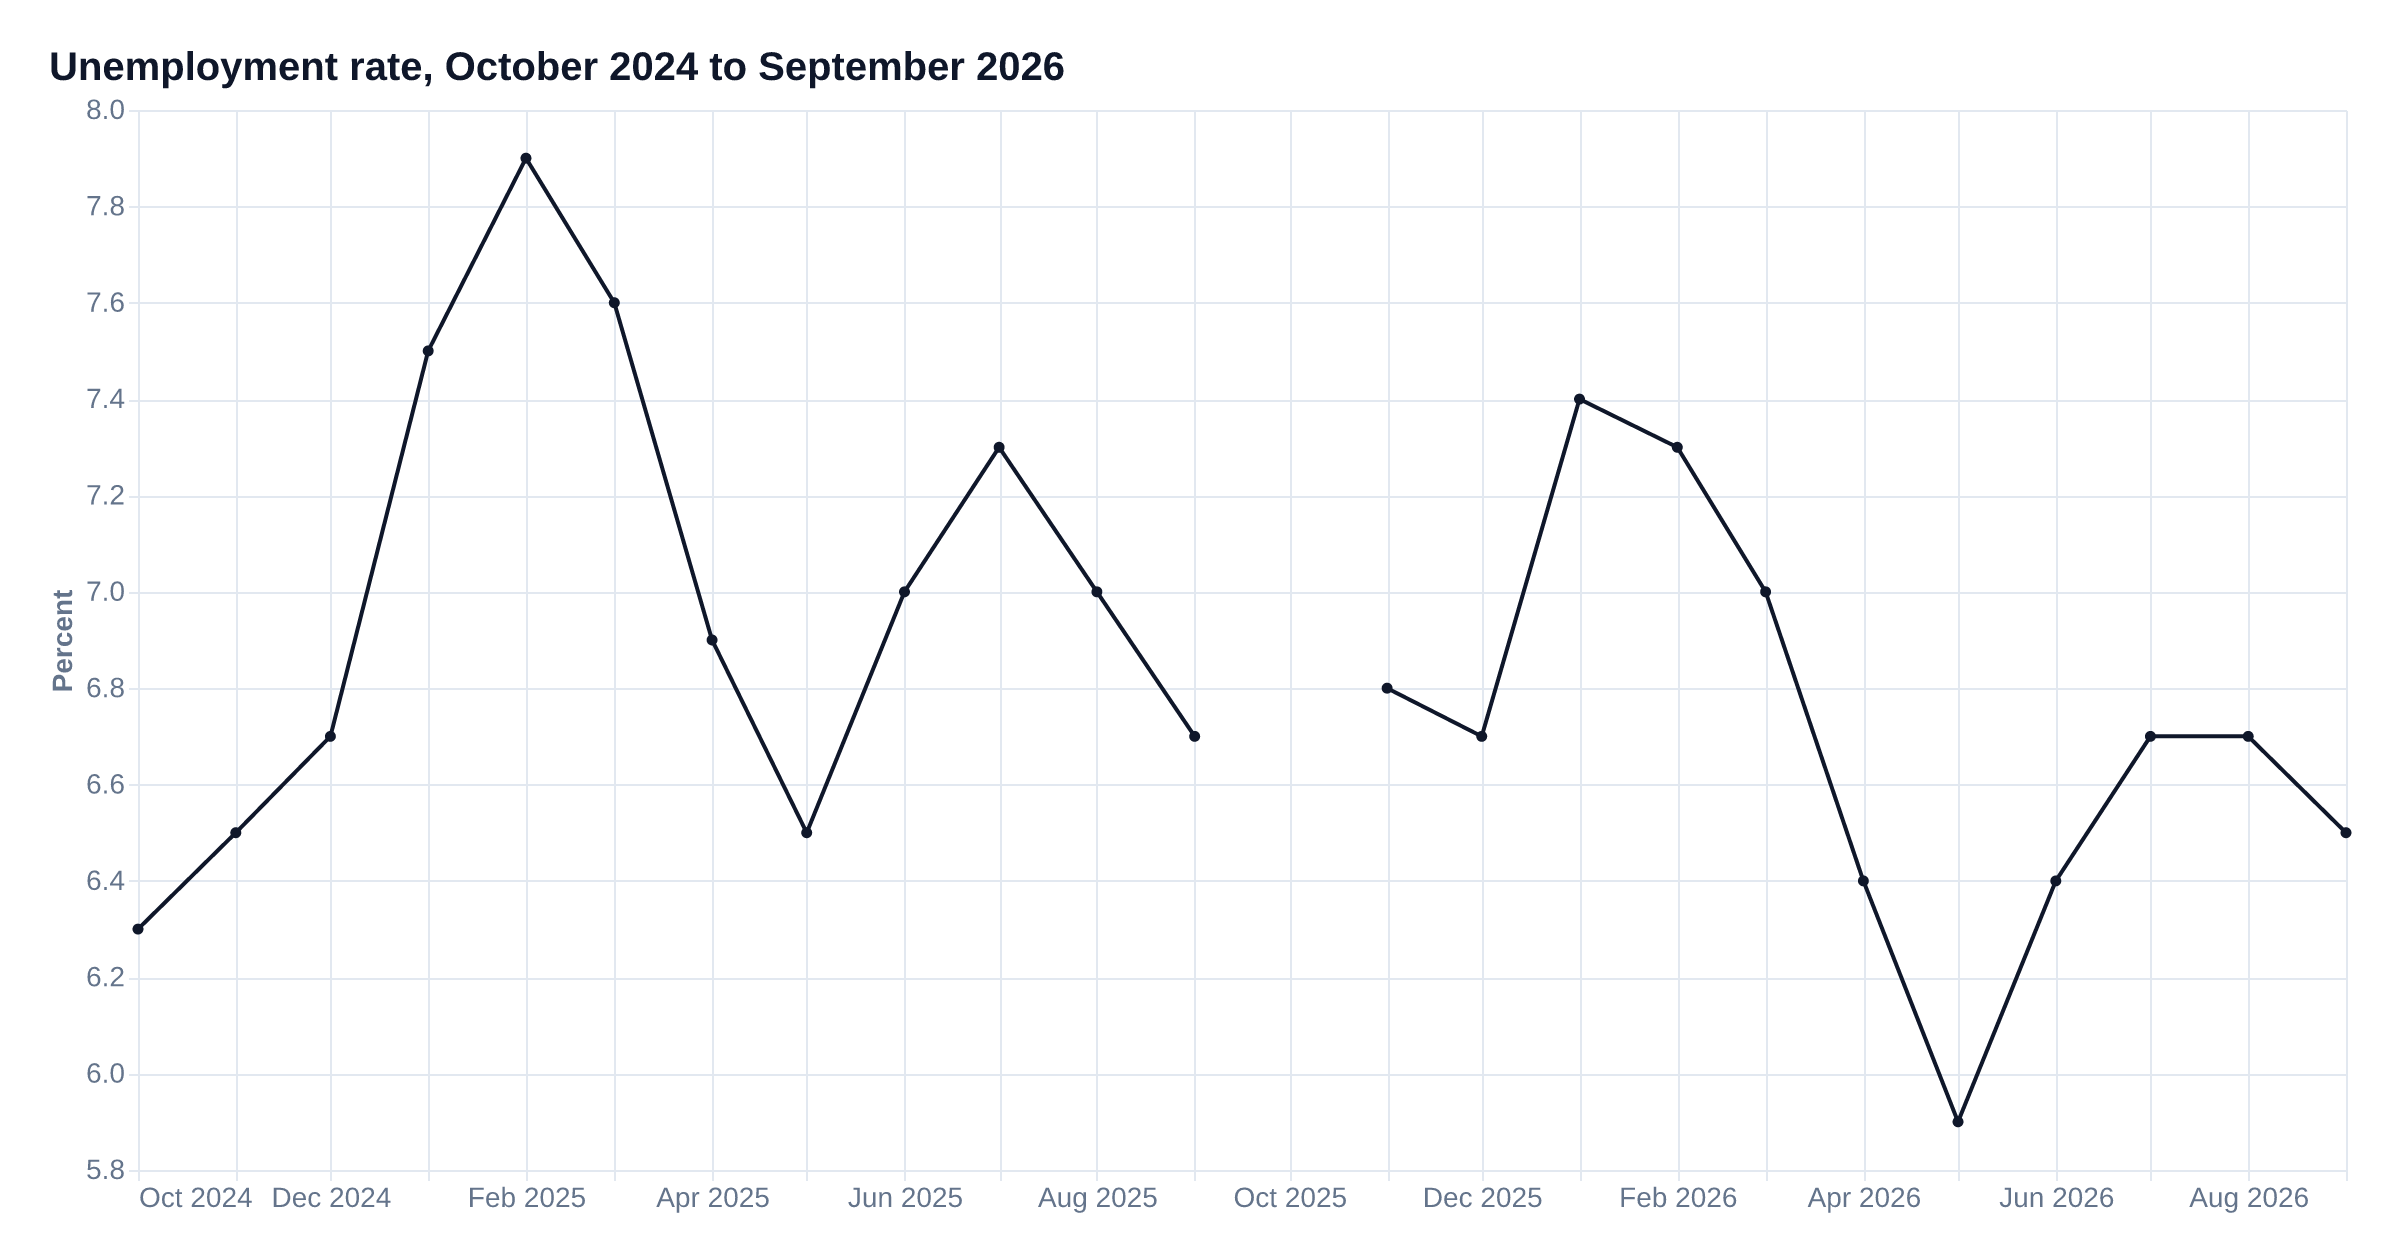
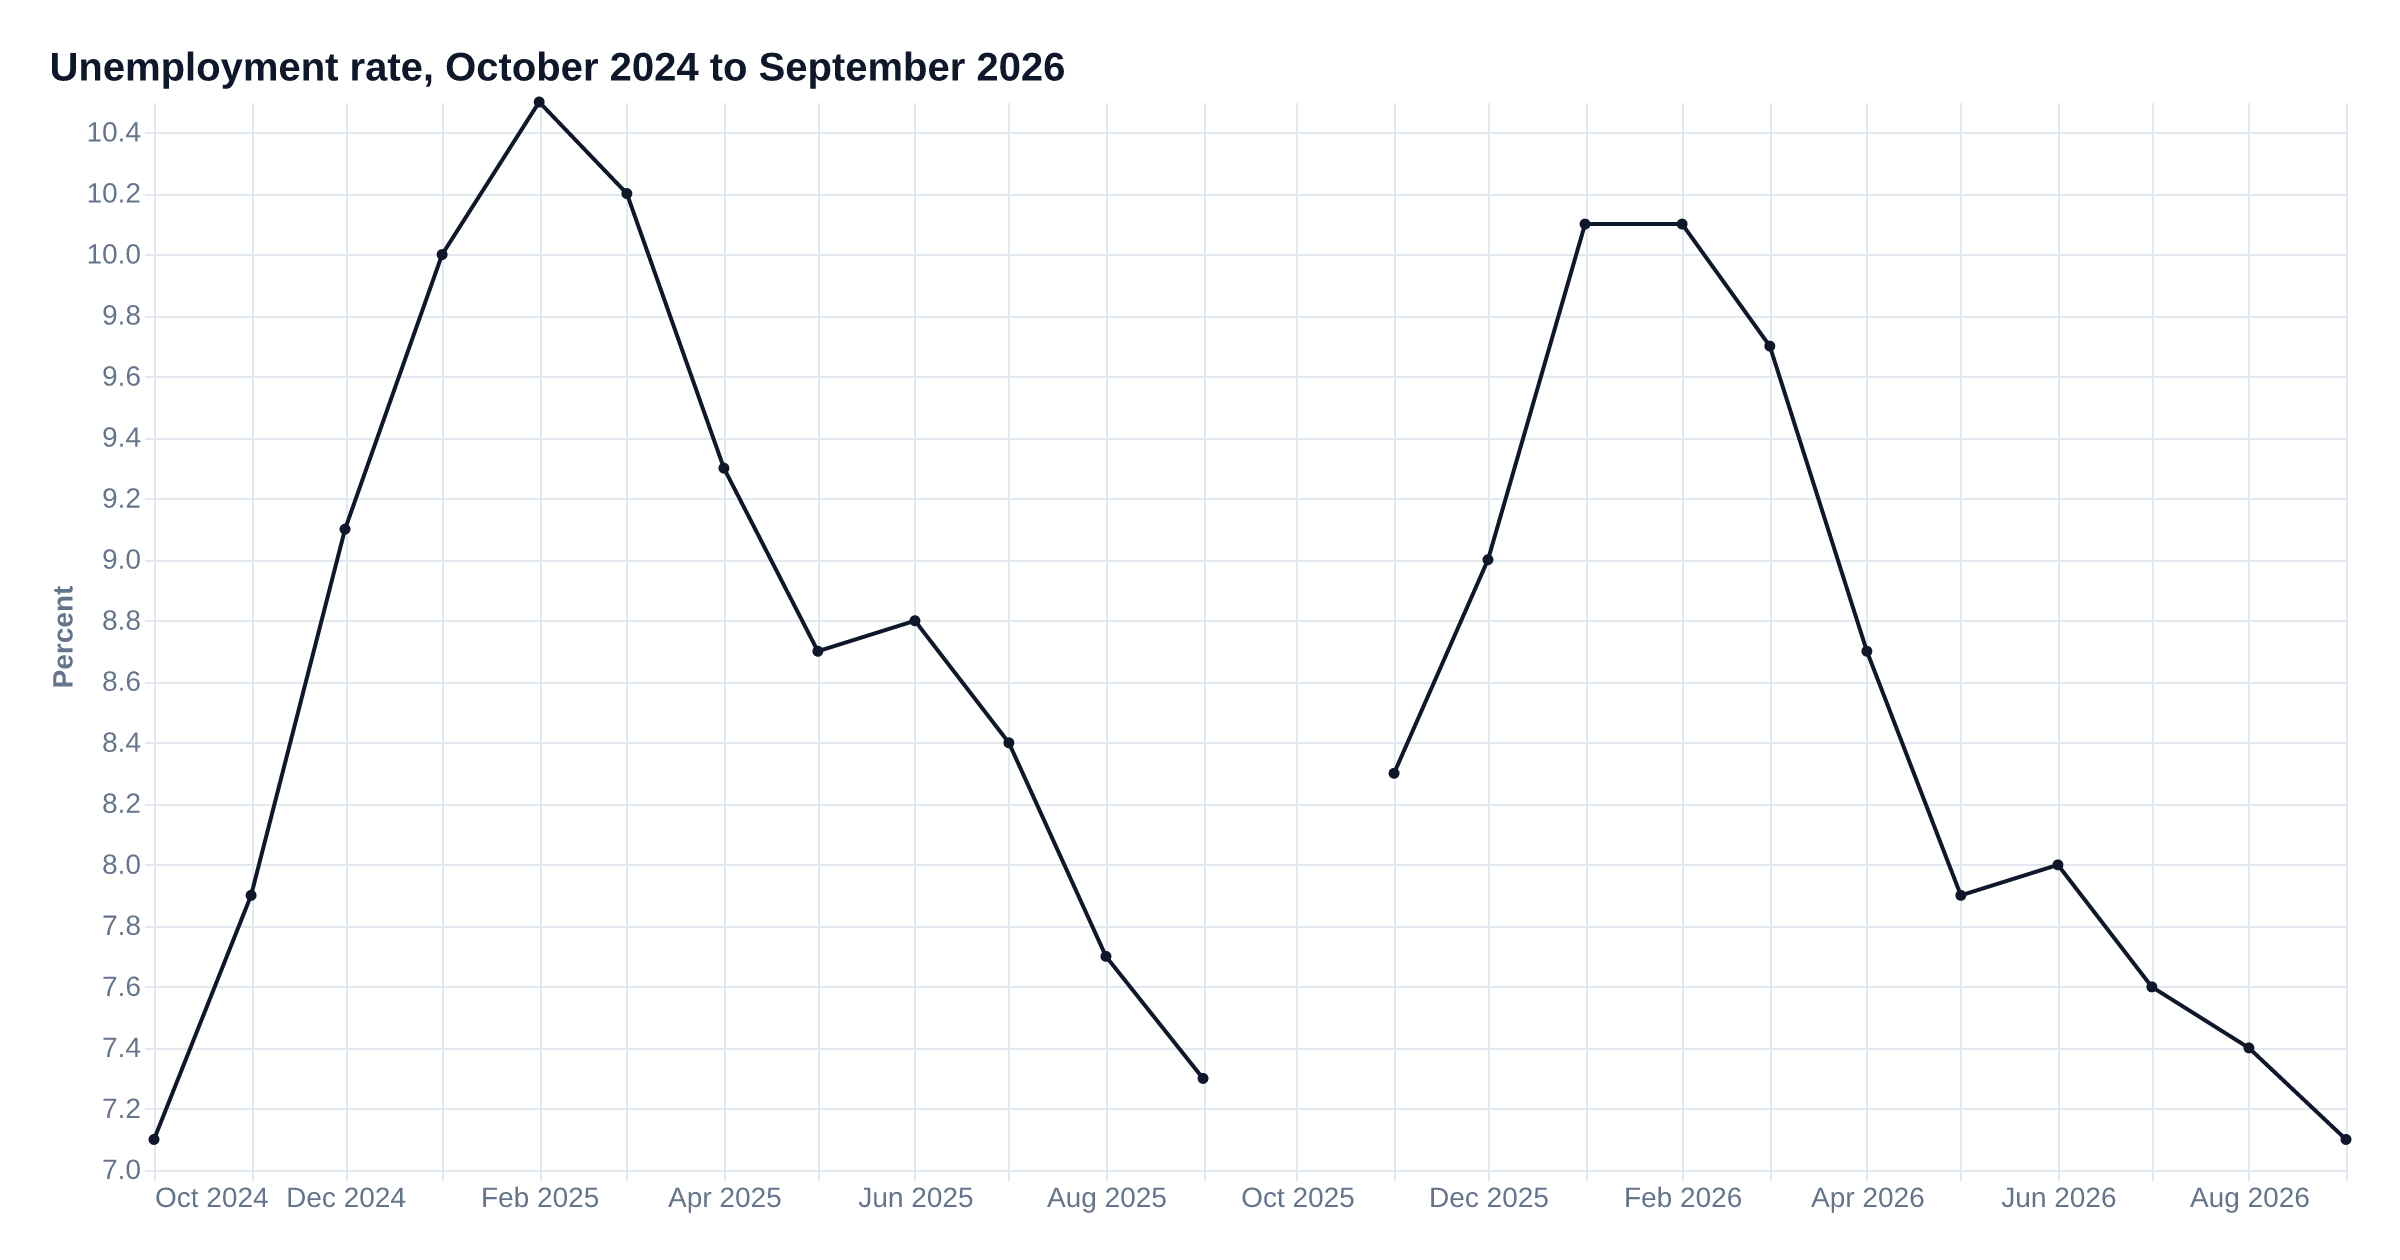
Of every September since 1990, this one included, 41% had a rate at or below this one. The change from a year earlier is not unusual by this test: it is within 2 standard deviations of the average year-over-year change in the previous 36 months. In September 2026 the state estimated California's rate at 5.1%. The national rate, 4.0%, comes from the U.S. Bureau of Labor Statistics' own household survey, so it is measured differently from the state's estimates.
Notes
- The state did not publish figures for October 2025.
How we calculated this
Changes compare a period with the same period a year earlier.Show the formula
change = value(this period) − value(same period last year); % change = change ÷ value(same period last year) × 100
Records and percentiles compare a value with every value for the same month or quarter, up to and including this one.Show the formula
percentile = share of same-month (or same-quarter) values up to and including this one that are at or below it × 100
Unemployment changes are compared with the changes of the three years before.Show the formula
z = (year-over-year change − mean of the year-over-year changes in the previous 36 months) ÷ their standard deviation, using only published months and only when at least 24 are available. Unusual when |z| > 2.
County figures are shown next to California and the United States for the same period.Show the formula
the same measure for California and the United States in the same period; where a change is shown for them, the same change formula
Records and percentiles need at least 10 earlier same-season values.Show the formula
History needed = 10
An unemployment change is called unusual when it is more than 2 standard deviations from the past three years of changes.Show the formula
Unusual unemployment change = 2
Unusual is judged against the 36 months before.Show the formula
Comparison window = 36
At least 24 of those months must be published for the comparison to be made.Show the formula
Months needed = 24
Rates are not seasonally adjusted, so a month is best compared with the same month in other years.
Source: California EDD, Local Area Unemployment Statistics, data released 2026-10-16; U.S. Bureau of Labor Statistics via FRED, data released 2026-10-26.