Humboldt County had an average of 52,442 payroll jobs a month in January–March 2026, public and private, +1,302 (+2.5%) from a year earlier. Of those, 37,275 were private-sector jobs, +420 (+1.1%). Over the same year, private payroll jobs changed +0.9% in California and +0.3% nationally.
Biggest changes
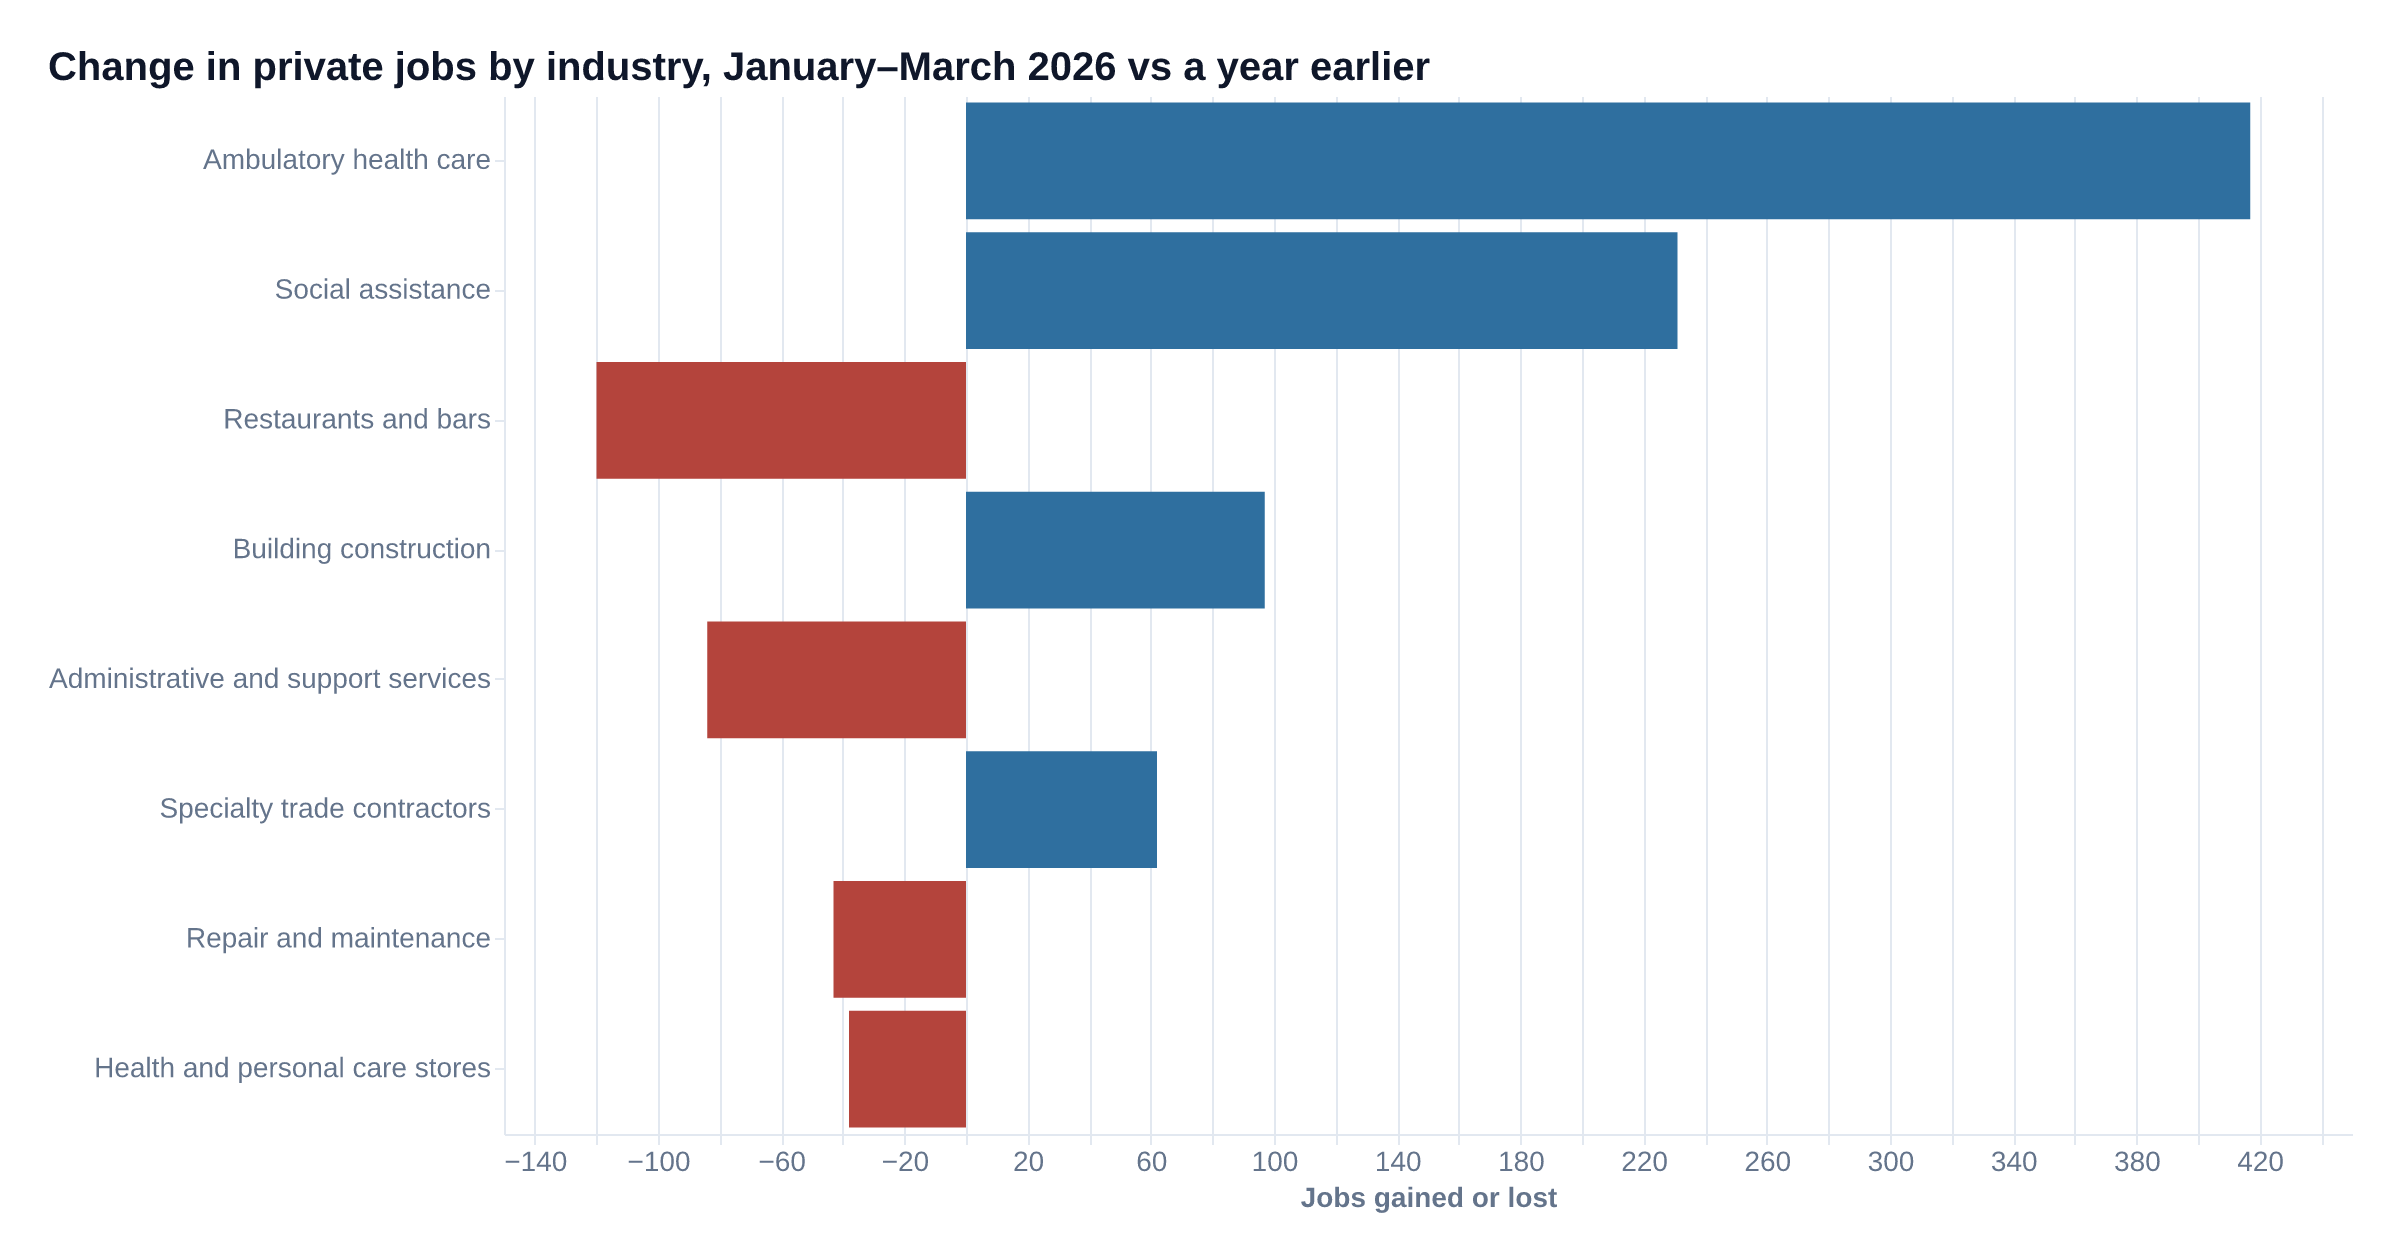
Left out of the ranking until checked: 3 private industries above the size floor whose weekly pay moved 15% or more in a year; the notes name them. Also left out: one private industry above the size floor whose figure for a year earlier was not published. Among private industries with at least 100 jobs this quarter, these gained or lost the most jobs over the year, ranked by the number of jobs:
| Industry | Jobs | Change | % change | Same industry statewide, % change |
|---|---|---|---|---|
| Ambulatory health care (doctors' offices, clinics, home health) | 2,929 | +417 | +16.6% | +2.9% |
| Social assistance (child care, family services, food banks) | 5,758 | +231 | +4.2% | +8.7% |
| Restaurants and bars | 3,727 | −120 | −3.1% | +0.9% |
| Building construction (homebuilders and commercial builders) | 956 | +97 | +11.3% | −2.6% |
| Administrative and support services (staffing agencies, security, janitorial) | 932 | −84 | −8.3% | −0.5% |
| Specialty trade contractors (electricians, plumbers, roofers) | 1,316 | +62 | +4.9% | −1.8% |
| Repair and maintenance (auto repair, equipment repair) | 485 | −43 | −8.1% | −1.6% |
| Health and personal care stores (pharmacies and drugstores) | 310 | −38 | −10.9% | −4.9% |
Changes in direction and pace
- Ambulatory health care (doctors' offices, clinics, home health): more jobs added than the year before, from +59 jobs the year before to +417 this year.
- Food manufacturing (food processing plants): a reversal, from −158 jobs the year before to +14 this year.
- Crop production (farms growing crops): fewer jobs lost than the year before, from −163 jobs the year before to −21 this year.
- Social assistance (child care, family services, food banks): fewer jobs added than the year before, from +356 jobs the year before to +231 this year.
- Administrative and support services (staffing agencies, security, janitorial): a reversal, from +36 jobs the year before to −84 this year.
- Building construction (homebuilders and commercial builders): 10 years in a row of gains in the first quarter.
- Crop production (farms growing crops): 5 years in a row of losses in the first quarter.
- Ambulatory health care (doctors' offices, clinics, home health): 5 years in a row of gains in the first quarter.
- Wholesale of nondurable goods (distributors of food, fuel, farm supplies): 4 years in a row of losses in the first quarter.
- Building material and garden stores: 4 years in a row of losses in the first quarter.
Notes
- Left out of the ranking, since average weekly pay changed by 15% or more in a year: heavy and civil engineering construction (roads, bridges, pipelines); sporting goods, hobby, book and other stores; broadcasting and content providers (radio, TV and online content).
- Not comparable with a year earlier, since one of the two figures was not published: farm and forestry support (contract crews and services for farms, ranches and forests).
How we calculated this
Changes compare a period with the same period a year earlier.Show the formula
change = value(this period) − value(same period last year); % change = change ÷ value(same period last year) × 100
County figures are shown next to California and the United States for the same period.Show the formula
the same measure for California and the United States in the same period; where a change is shown for them, the same change formula
Direction and pace compare this year's job change with last year's, quarter to same quarter.Show the formula
pace = change(this year) − change(last year). Reversal: the two changes have opposite signs. Acceleration: same direction, larger change. Deceleration: same direction, smaller or equal change. Flagged when |pace| ≥ 100 and the industry has at least 100 jobs.
A streak counts consecutive years of change in the same direction for the same quarter, in years the industry met the ranking's size floor.Show the formula
streak = number of consecutive years, ending this year, whose change from the year before has the same sign (no change ends a streak); jobs must meet the ranking's size floor in every year of it, the base year included.
An industry whose weekly pay moves 15% or more in a year is left out of rankings until checked; one whose pay moves 50% or more while its jobs move 30% or more is treated as a possible reclassification.Show the formula
Review when |weekly pay % change| ≥ 15. Possible reclassification when |weekly pay % change| ≥ 50 and |jobs % change| ≥ 30.
Industries are ranked by job change only if they had at least 100 jobs in the quarter shown.Show the formula
Size floor for job rankings = 100
A change in pace is flagged when this year's job change differs from last year's by 100 or more jobs.Show the formula
Change in pace = 100
Only industries with at least 100 jobs are checked for changes in direction or pace.Show the formula
Size floor for changes in pace = 100
A run of 3 or more years moving the same way, compared quarter to same quarter, is called out.Show the formula
Streaks called out = 3
These figures cover payroll jobs reported to the state's unemployment insurance program. Self-employed workers, most religious organizations and uniformed military are not included. The state does not publish figures that would identify an employer, so some industries are missing from the tables.
Source: California EDD, Quarterly Census of Employment and Wages, data released 2026-10-01.