This is part of Sidekick’s new civic data series, which reports the numbers that shape life in your county. The figures come straight from state and federal agencies, and we report them without adding opinion or narrative. Each article explains how the numbers were calculated, so you can check them yourself.
Private employers in Sutter County paid an average of $1,034 a week per job in January–March 2026, +3.0% from a year earlier, not adjusted for inflation. Over the last four quarters, pay per job came to about $55,000 a year. The private average was $2,006 a week in California, +3.0% from a year earlier, and $1,681 nationally, +4.0%. Government employers paid $1,500 a week at the federal level, $1,995 at the state level and $1,384 at the local level.
The largest ranked industry, restaurants and bars, with 2,743 jobs, paid $552 a week, 53% of the county private average.
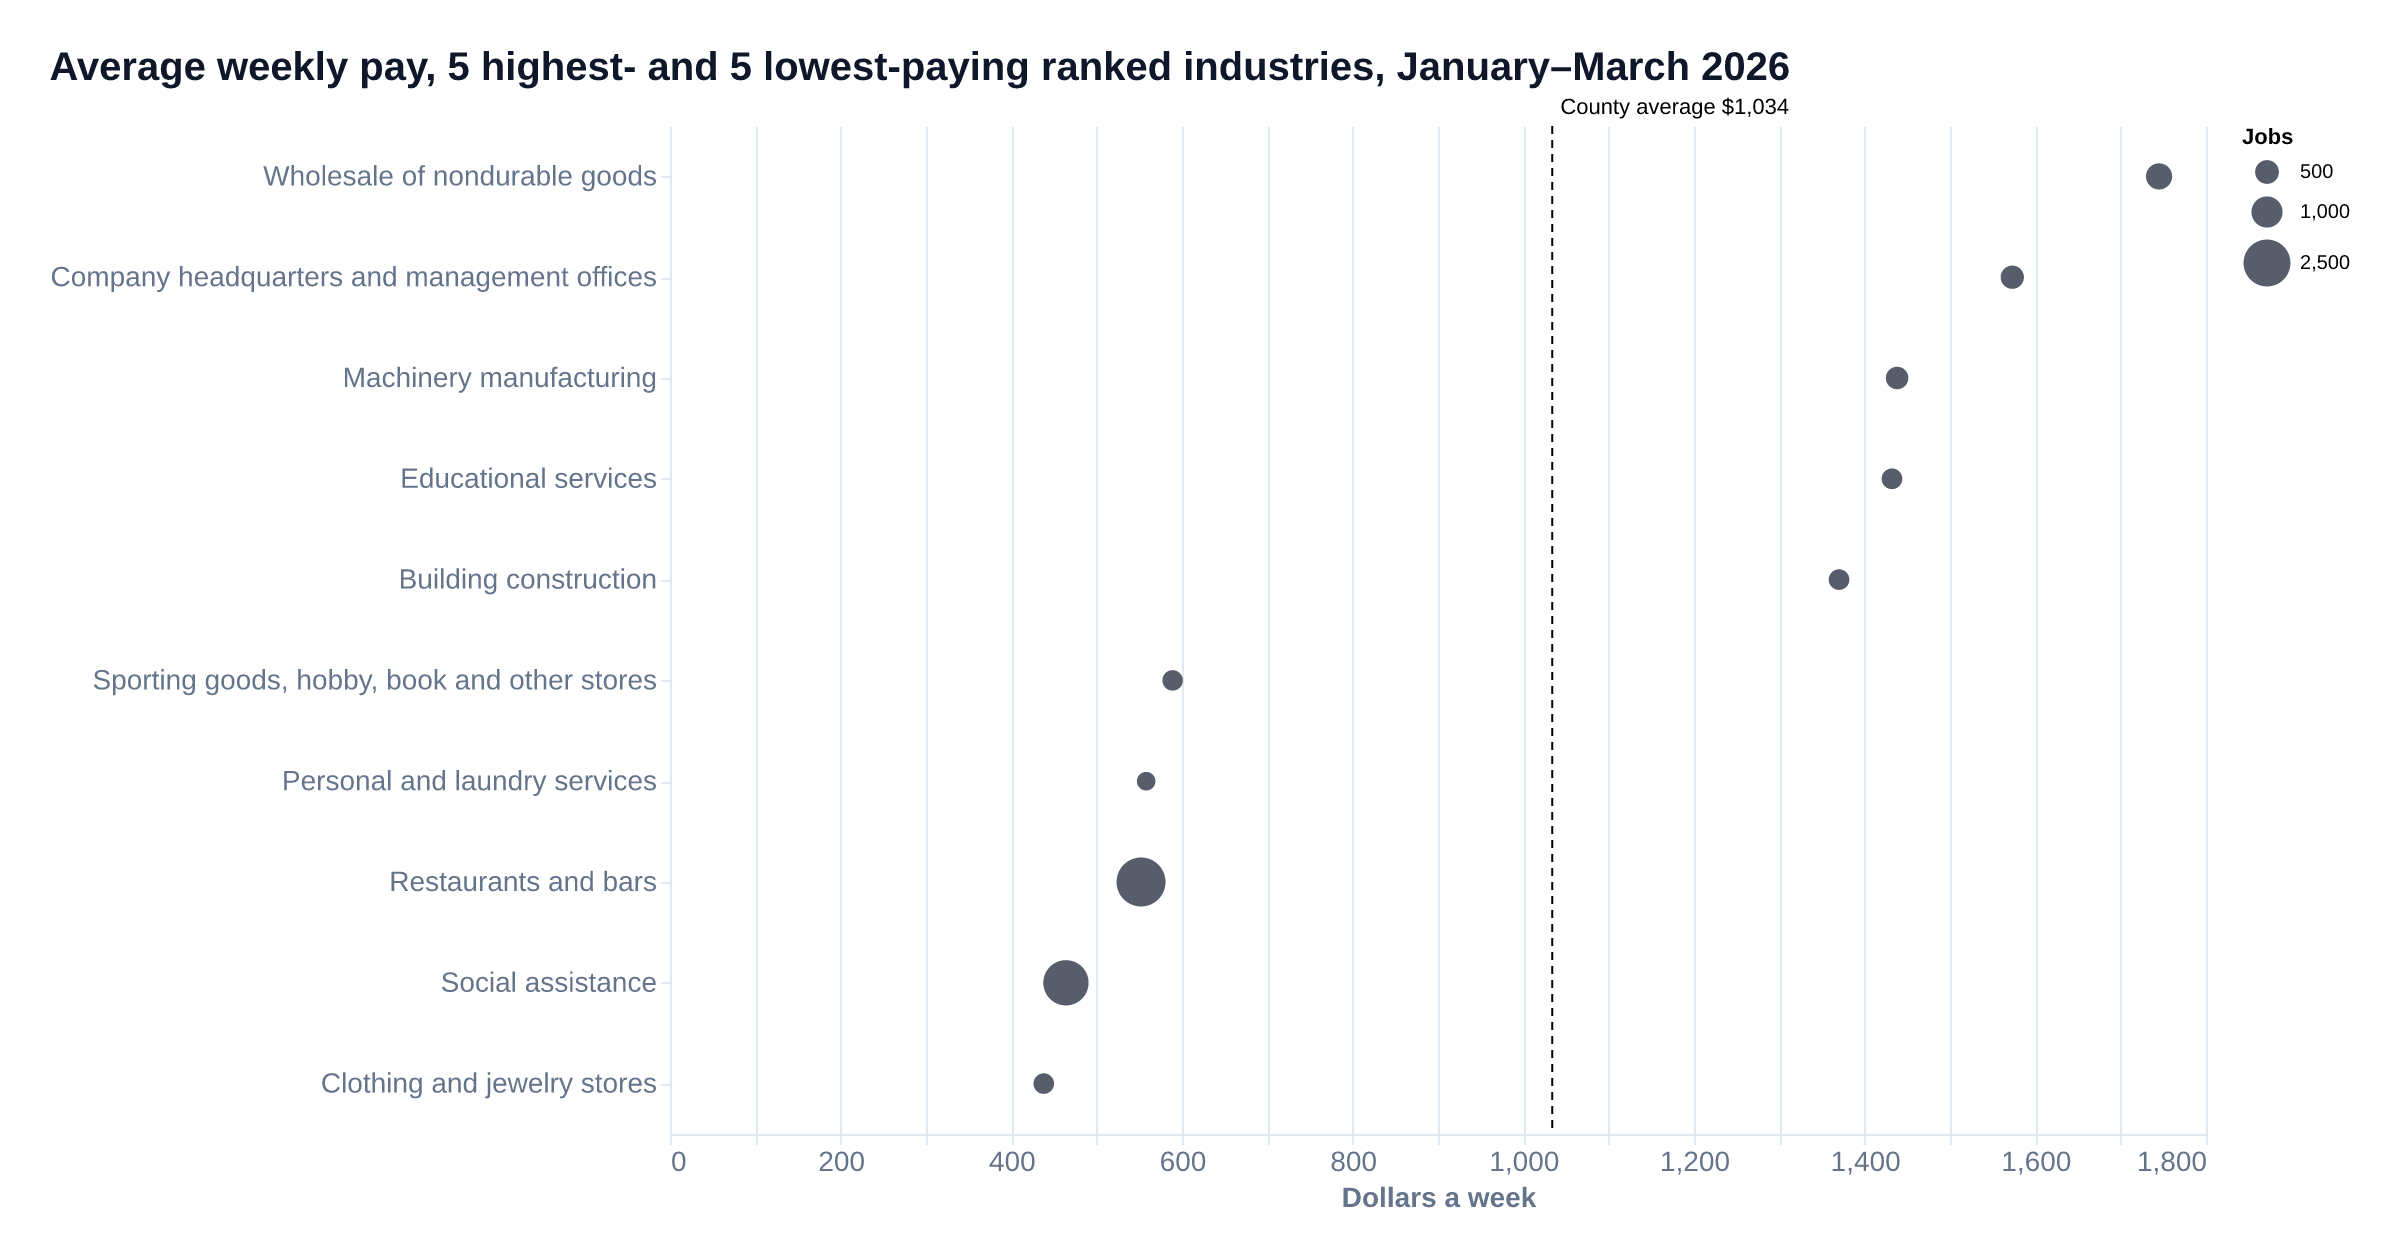
The 5 highest- and 5 lowest-paying ranked industries
Left out of the ranking until checked: 4 private industries above the size floor whose weekly pay moved 15% or more in a year; the notes name them. The 5 highest- and 5 lowest-paying of the ranked private industries with at least 200 jobs this quarter; the ones between are not shown:
| Industry | Jobs | Share of private jobs | Weekly pay | × county average | Yearly, last 4 quarters | Pay change |
|---|---|---|---|---|---|---|
| Wholesale of nondurable goods (distributors of food, fuel, farm supplies) | 647 | 2.4% | $1,745 | 1.69× | $89,000 | +7.3% |
| Company headquarters and management offices | 471 | 1.7% | $1,573 | 1.52× | n/c | −0.6% |
| Machinery manufacturing | 429 | 1.6% | $1,438 | 1.39× | $87,000 | −6.2% |
| Educational services (private schools, colleges, training) | 333 | 1.2% | $1,432 | 1.38× | $70,000 | +13.3% |
| Building construction (homebuilders and commercial builders) | 330 | 1.2% | $1,370 | 1.32× | $81,000 | +4.9% |
| Sporting goods, hobby, book and other stores | 319 | 1.2% | $589 | 0.57× | $32,000 | 0.0% |
| Personal and laundry services (salons, dry cleaners, funeral homes) | 229 | 0.8% | $558 | 0.54× | $30,000 | +5.3% |
| Restaurants and bars | 2,743 | 10.2% | $552 | 0.53× | $28,000 | +6.2% |
| Social assistance (child care, family services, food banks) | 2,318 | 8.6% | $464 | 0.45× | $25,000 | +5.2% |
| Clothing and jewelry stores | 326 | 1.2% | $438 | 0.42× | $23,000 | −2.0% |
Pay over the year
Of all 26 ranked industries, average weekly pay rose the most by percentage over the year in educational services, with 333 jobs at $1,432 a week (+13.3%, not adjusted for inflation). It fell the most by percentage in gas stations and fuel dealers, with 247 jobs at $708 a week (−9.7%).
Notes
- Not ranked until checked: amusement, gambling and recreation (casinos, gyms, golf courses), with 361 jobs, where average weekly pay changed +46.1% in a year.
- Not ranked until checked: banking and lending (banks, credit unions, lenders), with 388 jobs, where average weekly pay changed +18.3% in a year.
- Not ranked until checked: ambulatory health care (doctors' offices, clinics, home health), with 2,055 jobs, where average weekly pay changed −16.7% in a year.
- Series note: in hospitals, average weekly pay went from $1,366 to $2,839 and jobs from 353 to 499 in a year. Changes this large are consistent with employers being reclassified between industry codes, so the industry is treated as a possible series break, not a trend, and left out of the rankings.
- In company headquarters and management offices, jobs went from 314 to 471 in a year, so its pay per job averages over a different mix of jobs than a year earlier.
- In machinery manufacturing, jobs went from 253 to 429 in a year, so its pay per job averages over a different mix of jobs than a year earlier.
- n/c in the yearly column means not computable: the state did not publish pay or jobs for at least one of the last four quarters.
How we calculated this
Changes compare a period with the same period a year earlier.Show the formula
change = value(this period) − value(same period last year); % change = change ÷ value(same period last year) × 100
An industry whose weekly pay moves 15% or more in a year is left out of rankings until checked; one whose pay moves 50% or more while its jobs move 30% or more is treated as a possible reclassification.Show the formula
Review when |weekly pay % change| ≥ 15. Possible reclassification when |weekly pay % change| ≥ 50 and |jobs % change| ≥ 30.
County figures are shown next to California and the United States for the same period.Show the formula
the same measure for California and the United States in the same period; where a change is shown for them, the same change formula
Industries are ranked by pay only if they had at least 200 jobs in the quarter shown.Show the formula
Size floor for pay rankings = 200
A ranked industry whose jobs changed 30% or more in a year gets a note that its pay per job covers a different mix of jobs than a year earlier.Show the formula
Large job changes = 30
These figures cover payroll jobs reported to the state's unemployment insurance program. Self-employed workers, most religious organizations and uniformed military are not included. The state does not publish figures that would identify an employer, so some industries are missing from the tables.
Weekly pay is a quarter's total payroll divided by employment and by 13 weeks, so it reflects hours worked and the mix of jobs as well as pay rates.
Source: California EDD, Quarterly Census of Employment and Wages, data released 2026-10-01.