This is Sidekick's data series, which covers the raw numbers behind life in Yuba County: jobs, pay, sales and housing. Each article is built from official public statistics. We report what the numbers show and explain what they measure, without editorializing.
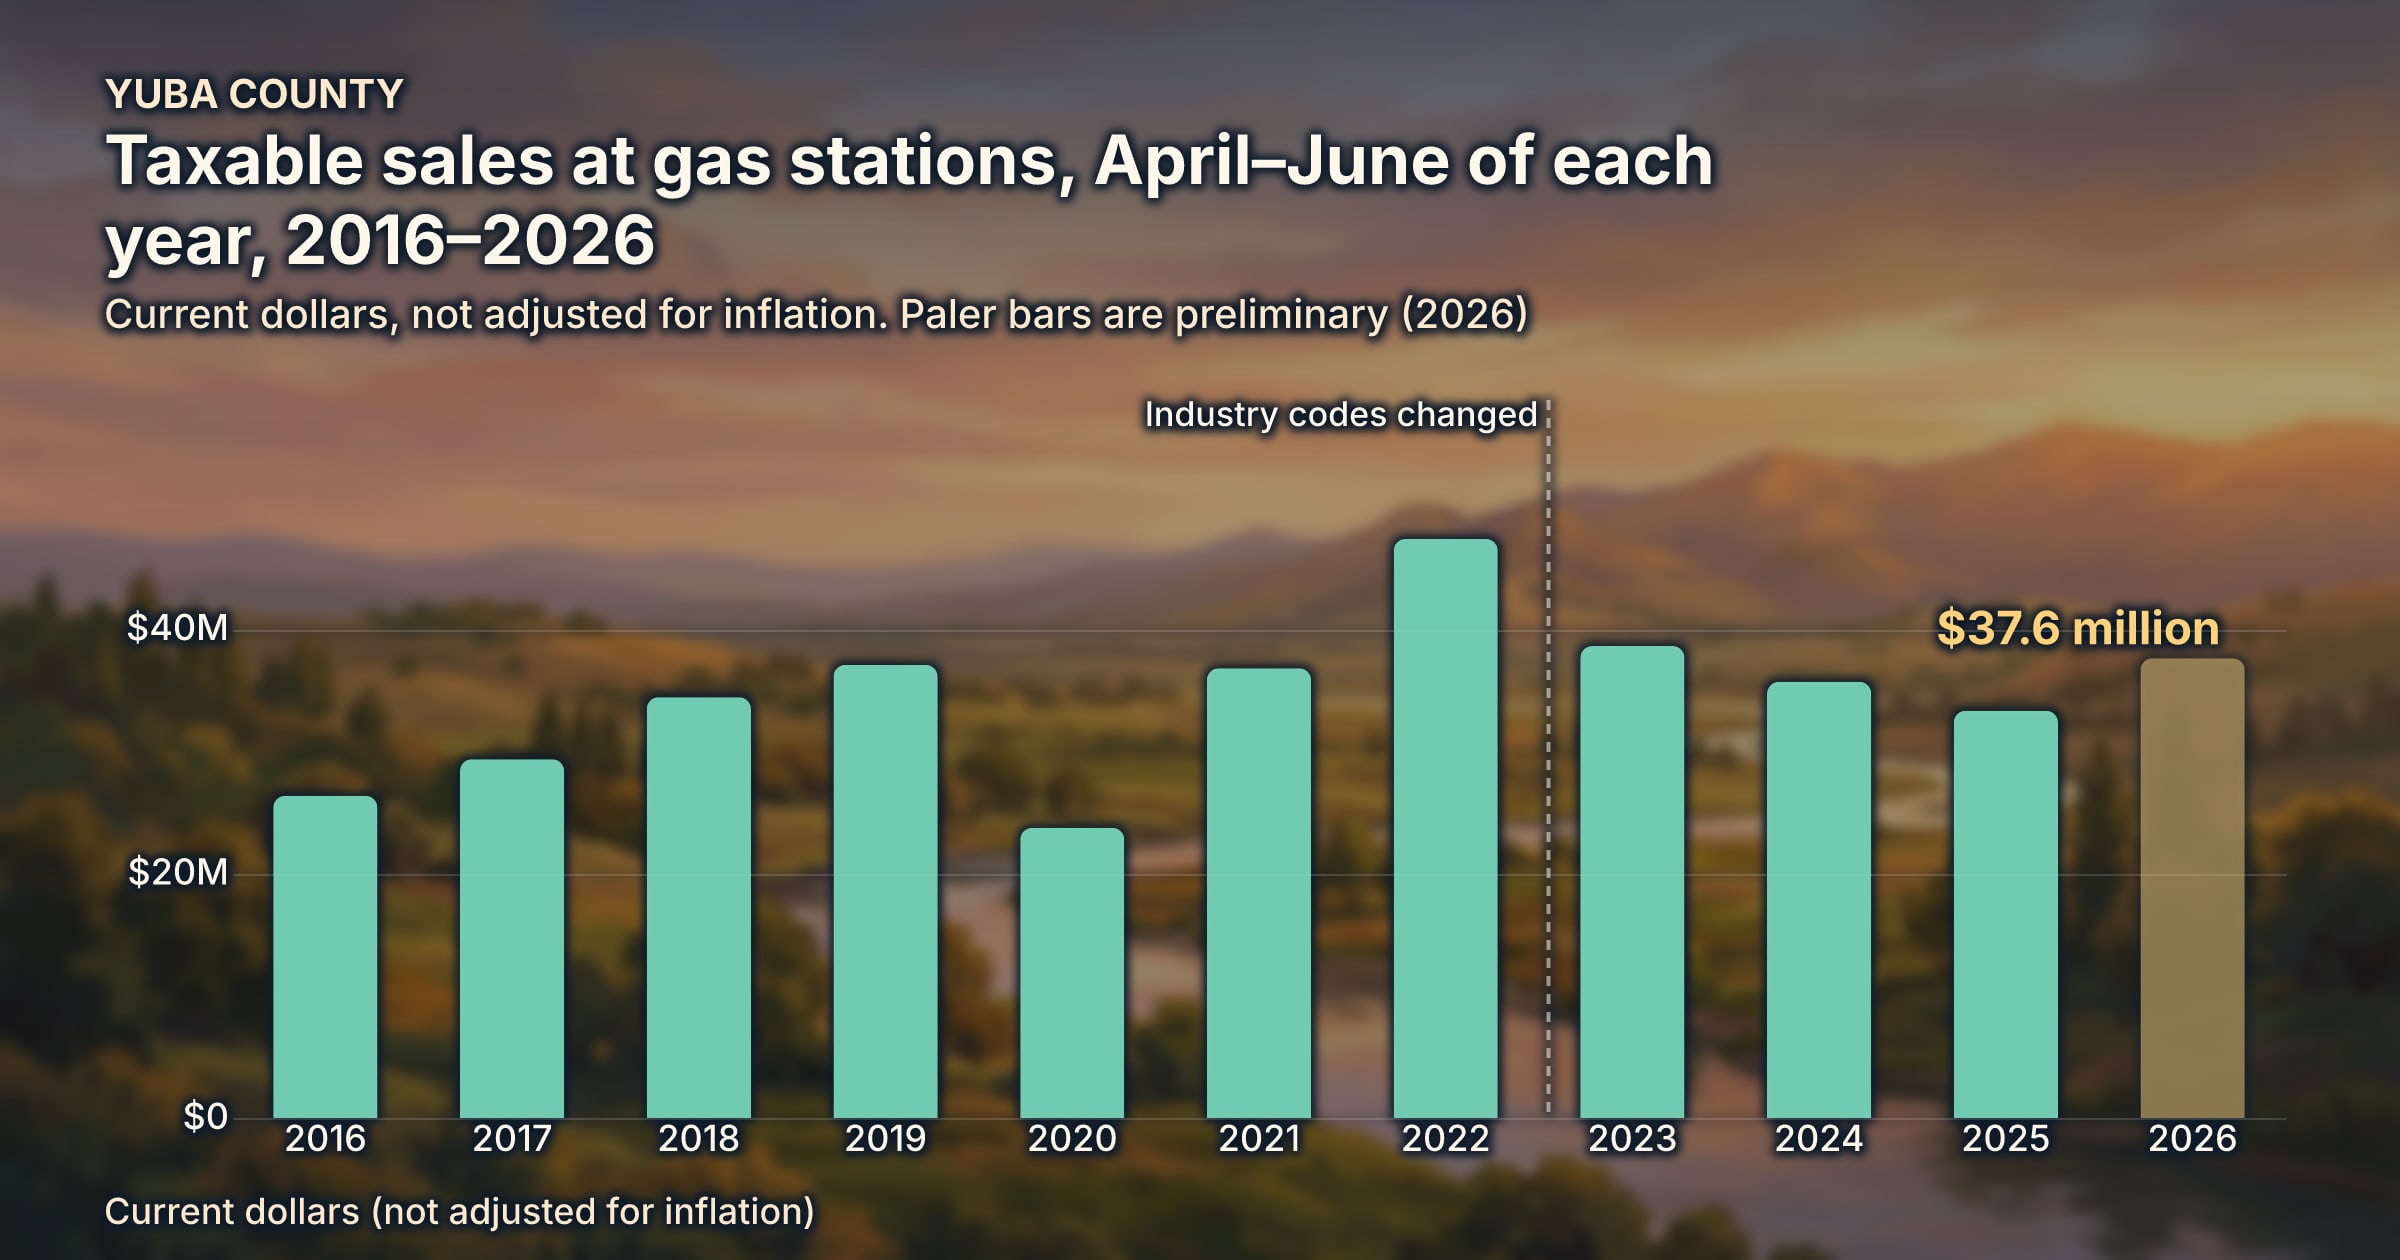
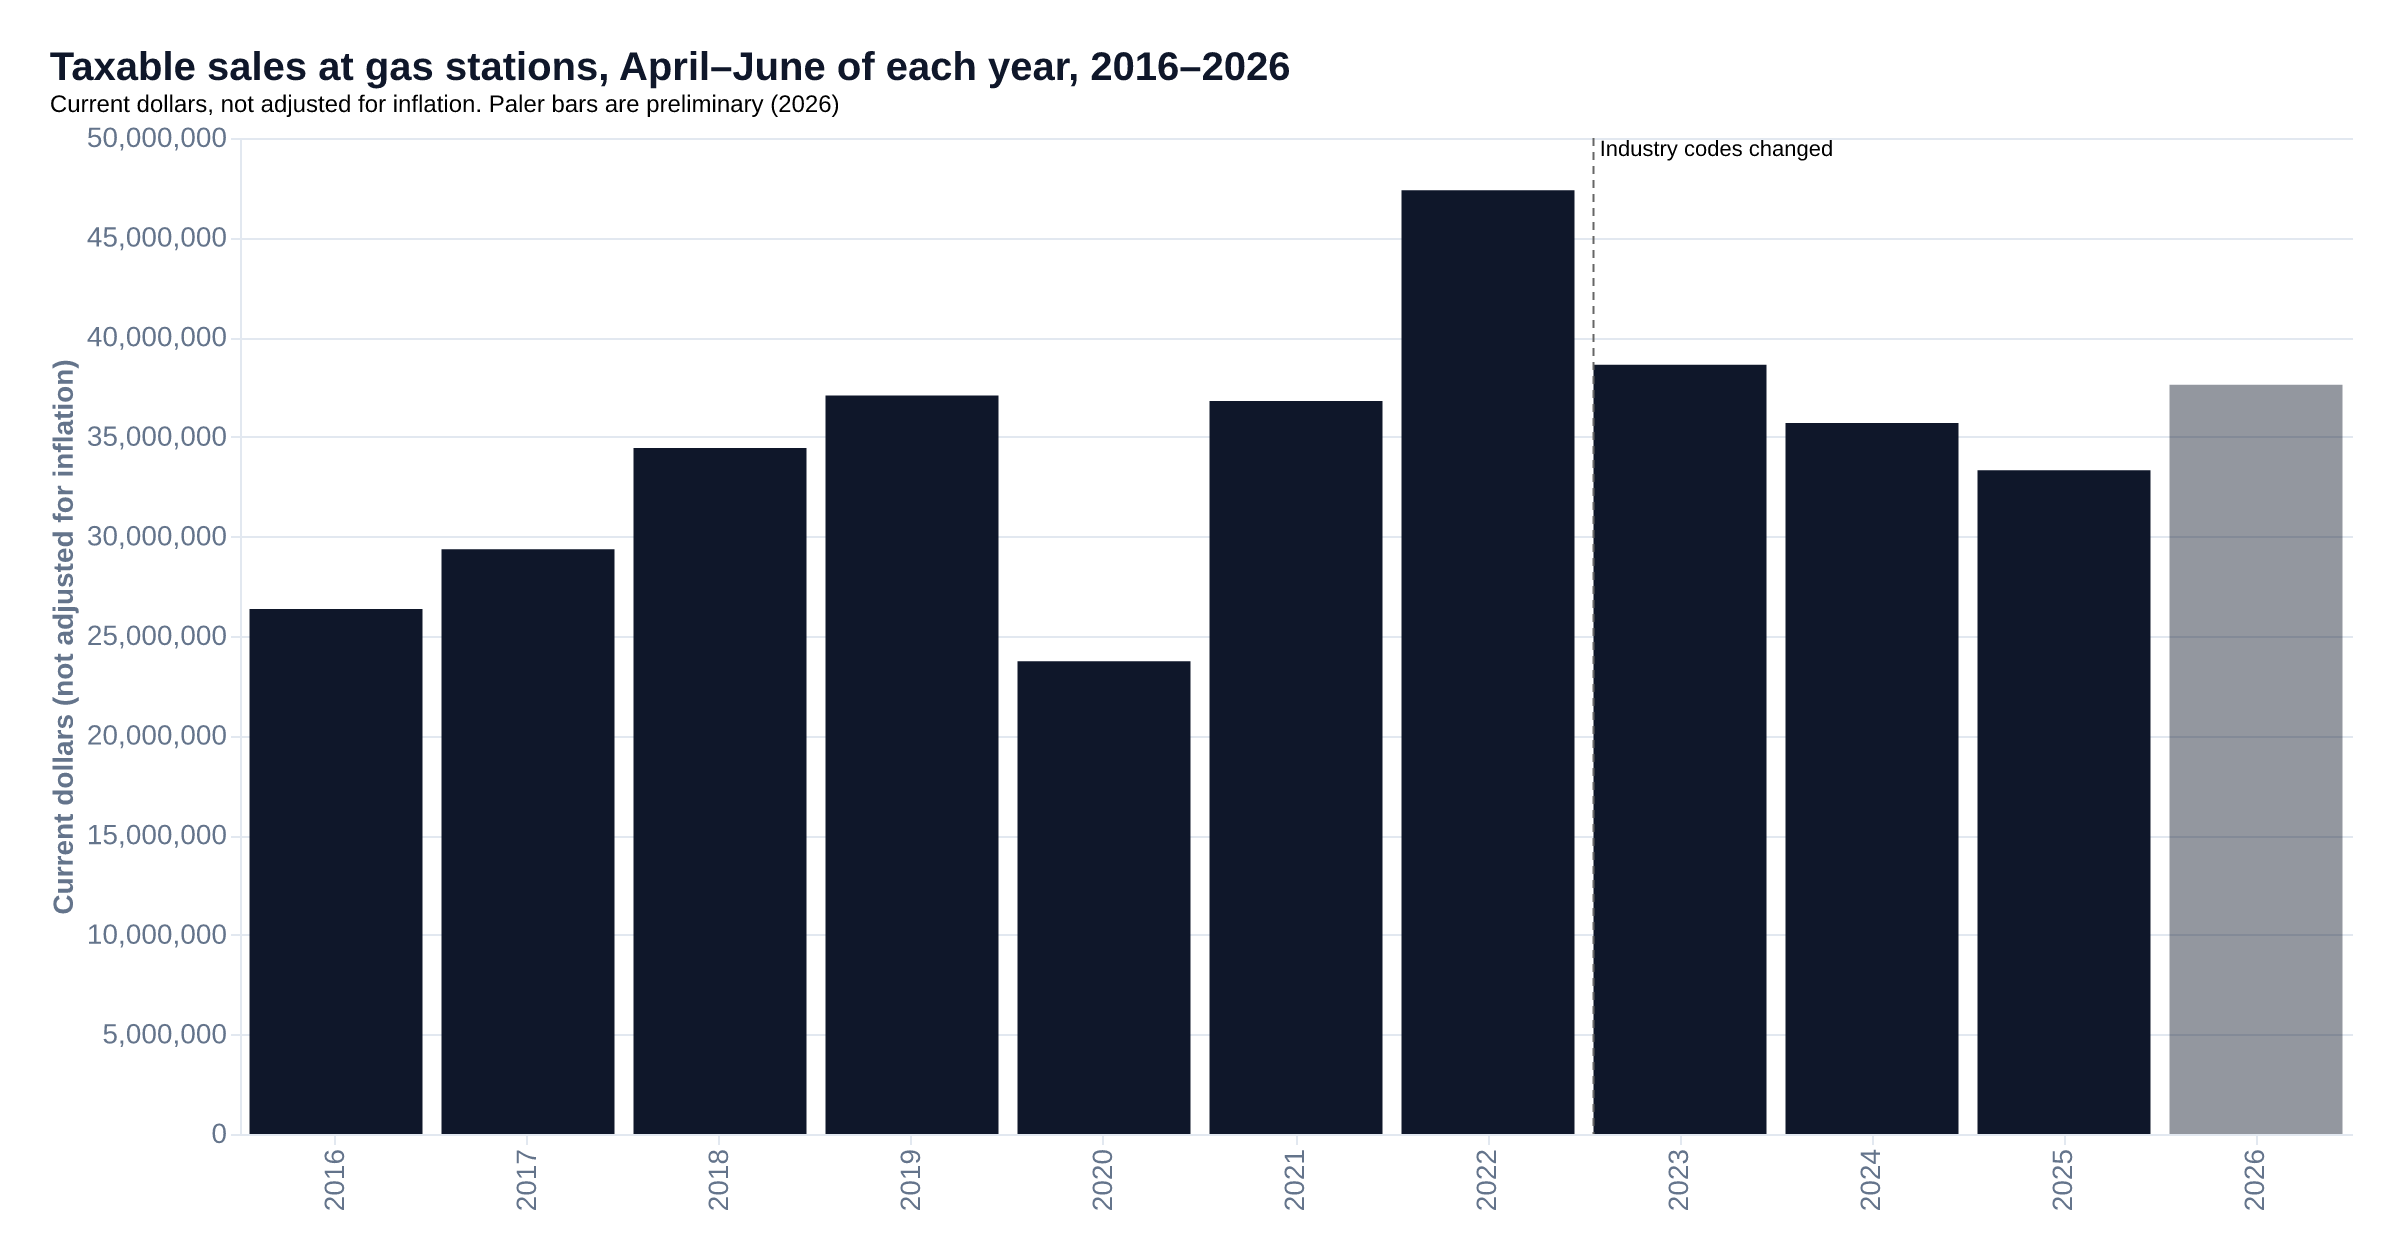
Taxable sales at gas stations in Yuba County came to $37.6 million in April–June 2026, +$4.3 million (+12.9%) from a year earlier. This category was 12.8% of all taxable sales in the county. These are current dollars, not adjusted for inflation. The April–June 2026 figures are preliminary; the agency revises them, and the comparisons here are redone with the revised figures.
What this measures
This is what gas stations in the county reported in taxable sales, including taxable items sold in their convenience stores.
Why this metric matters
Households, businesses and travelers all buy fuel, which makes these stations a regular part of local retail. Sales move with pump prices as well as gallons sold, and the figure alone does not separate the two, so it is best read alongside local gas prices.
Notes
- In 2023 the state moved to newer industry codes, which shifted some stores between categories, so store-type figures from before then do not always match exactly.
How we calculated this
Changes compare a period with the same period a year earlier.Show the formula
change = value(this period) − value(same period last year); % change = change ÷ value(same period last year) × 100
A dollar figure is reported as little changed only when its change from a year earlier rounds to 0.0%.Show the formula
little changed when the % change, to one decimal place, is 0.0
Taxable sales count only sales subject to the state sales tax, which leaves out most groceries, prescription drugs and services. Figures are in current dollars, not adjusted for inflation.
Gas station sales move with fuel prices as well as with the number of gallons sold.
Source: California Department of Tax and Fee Administration, data released 2026-09-10.