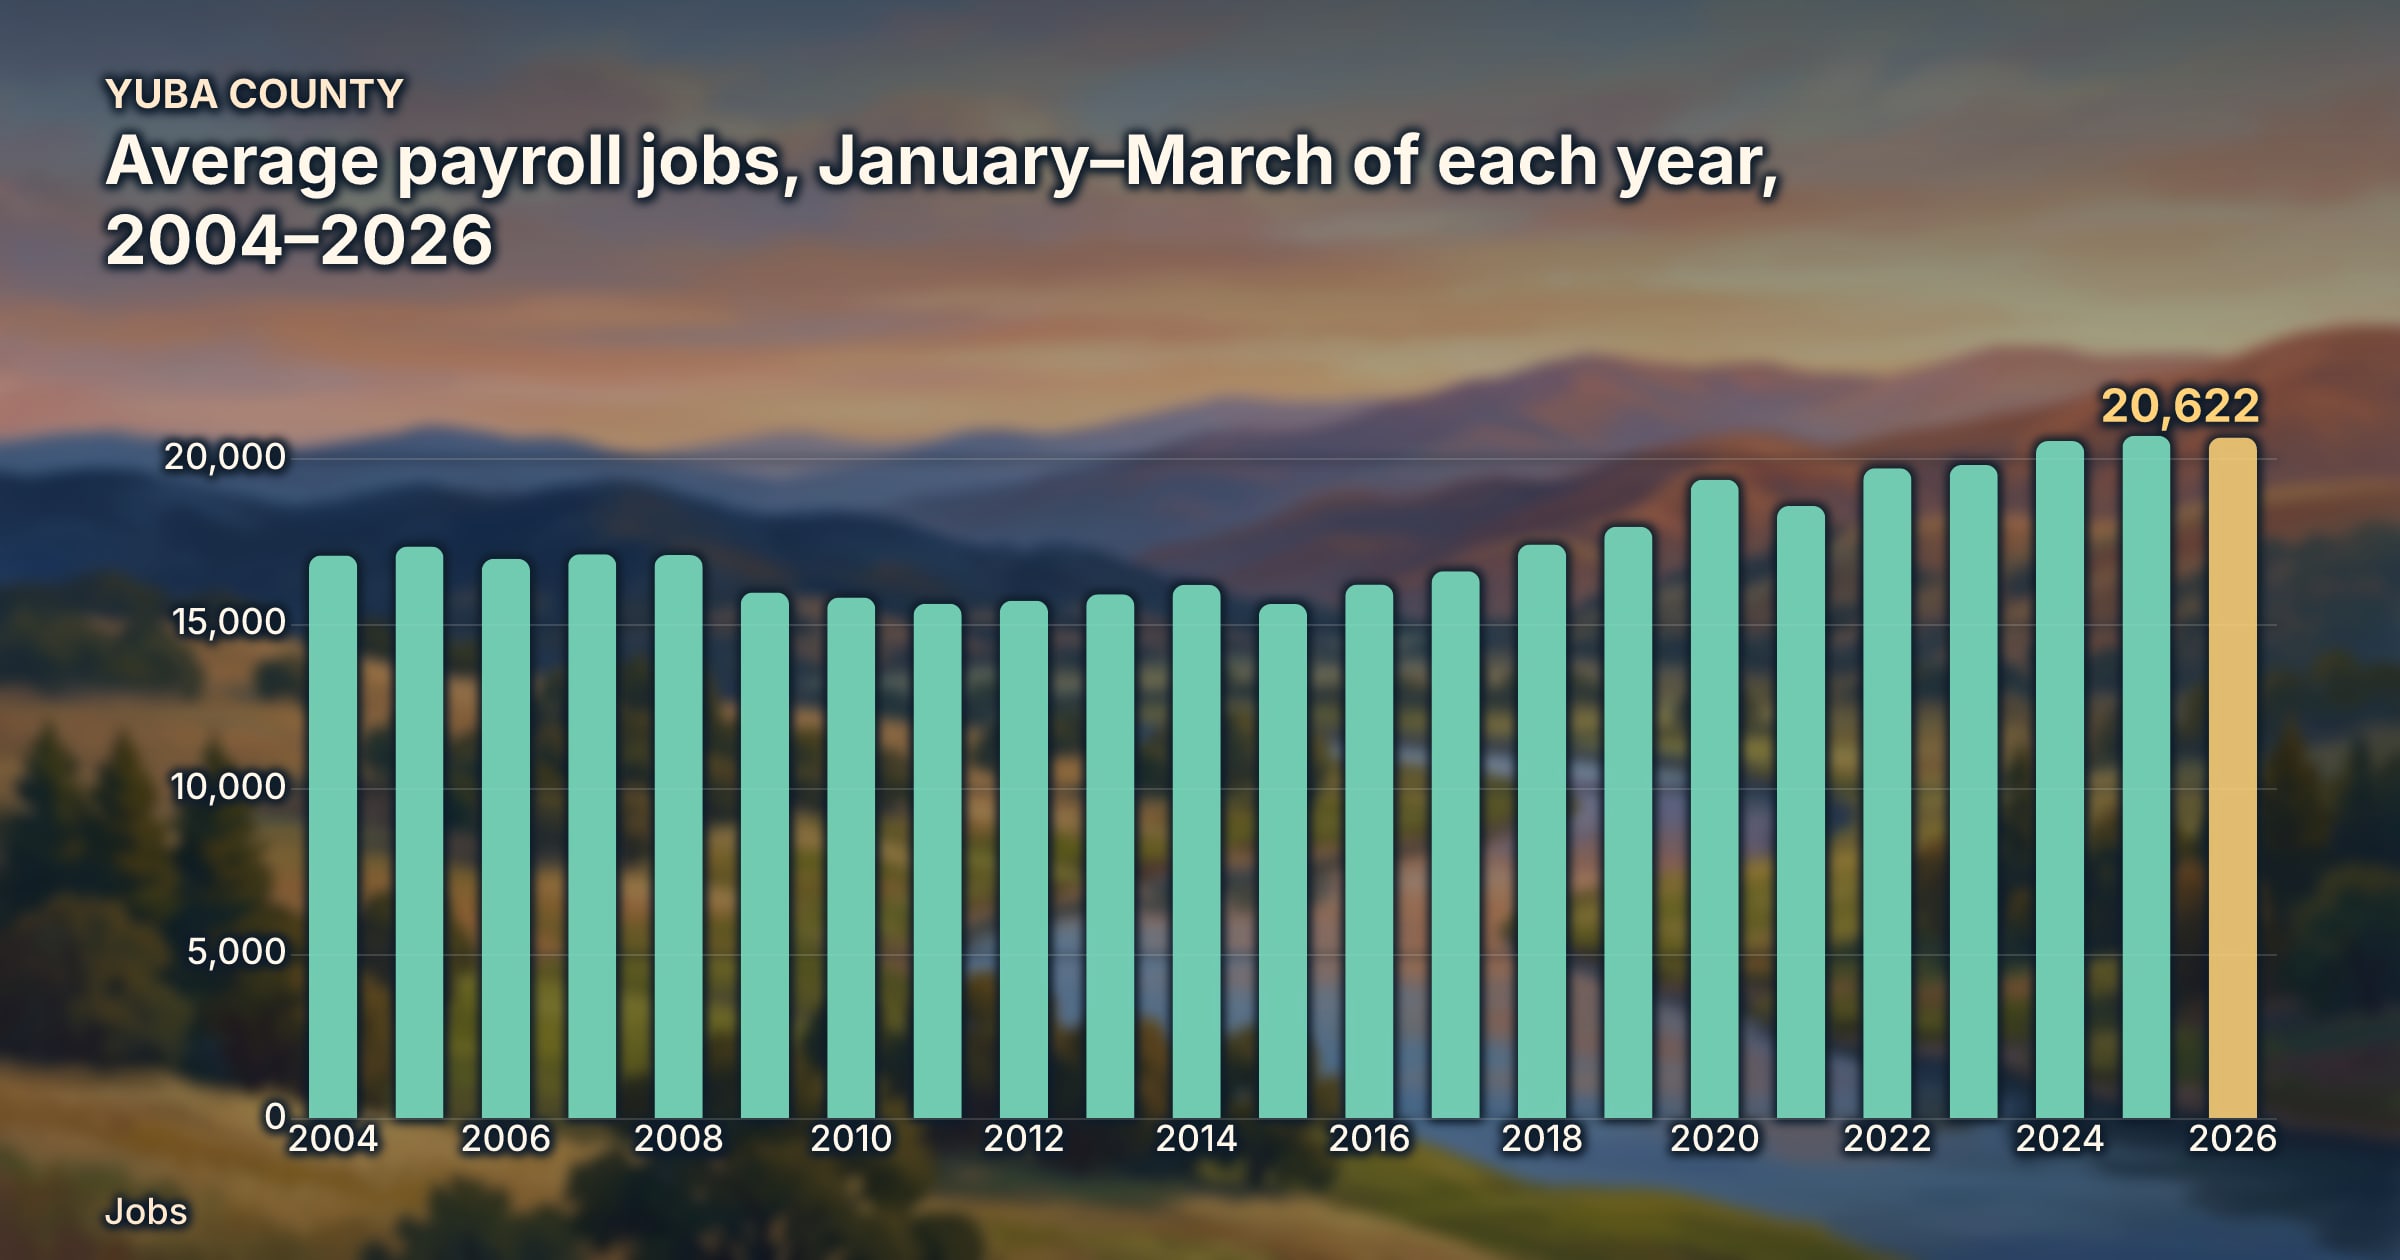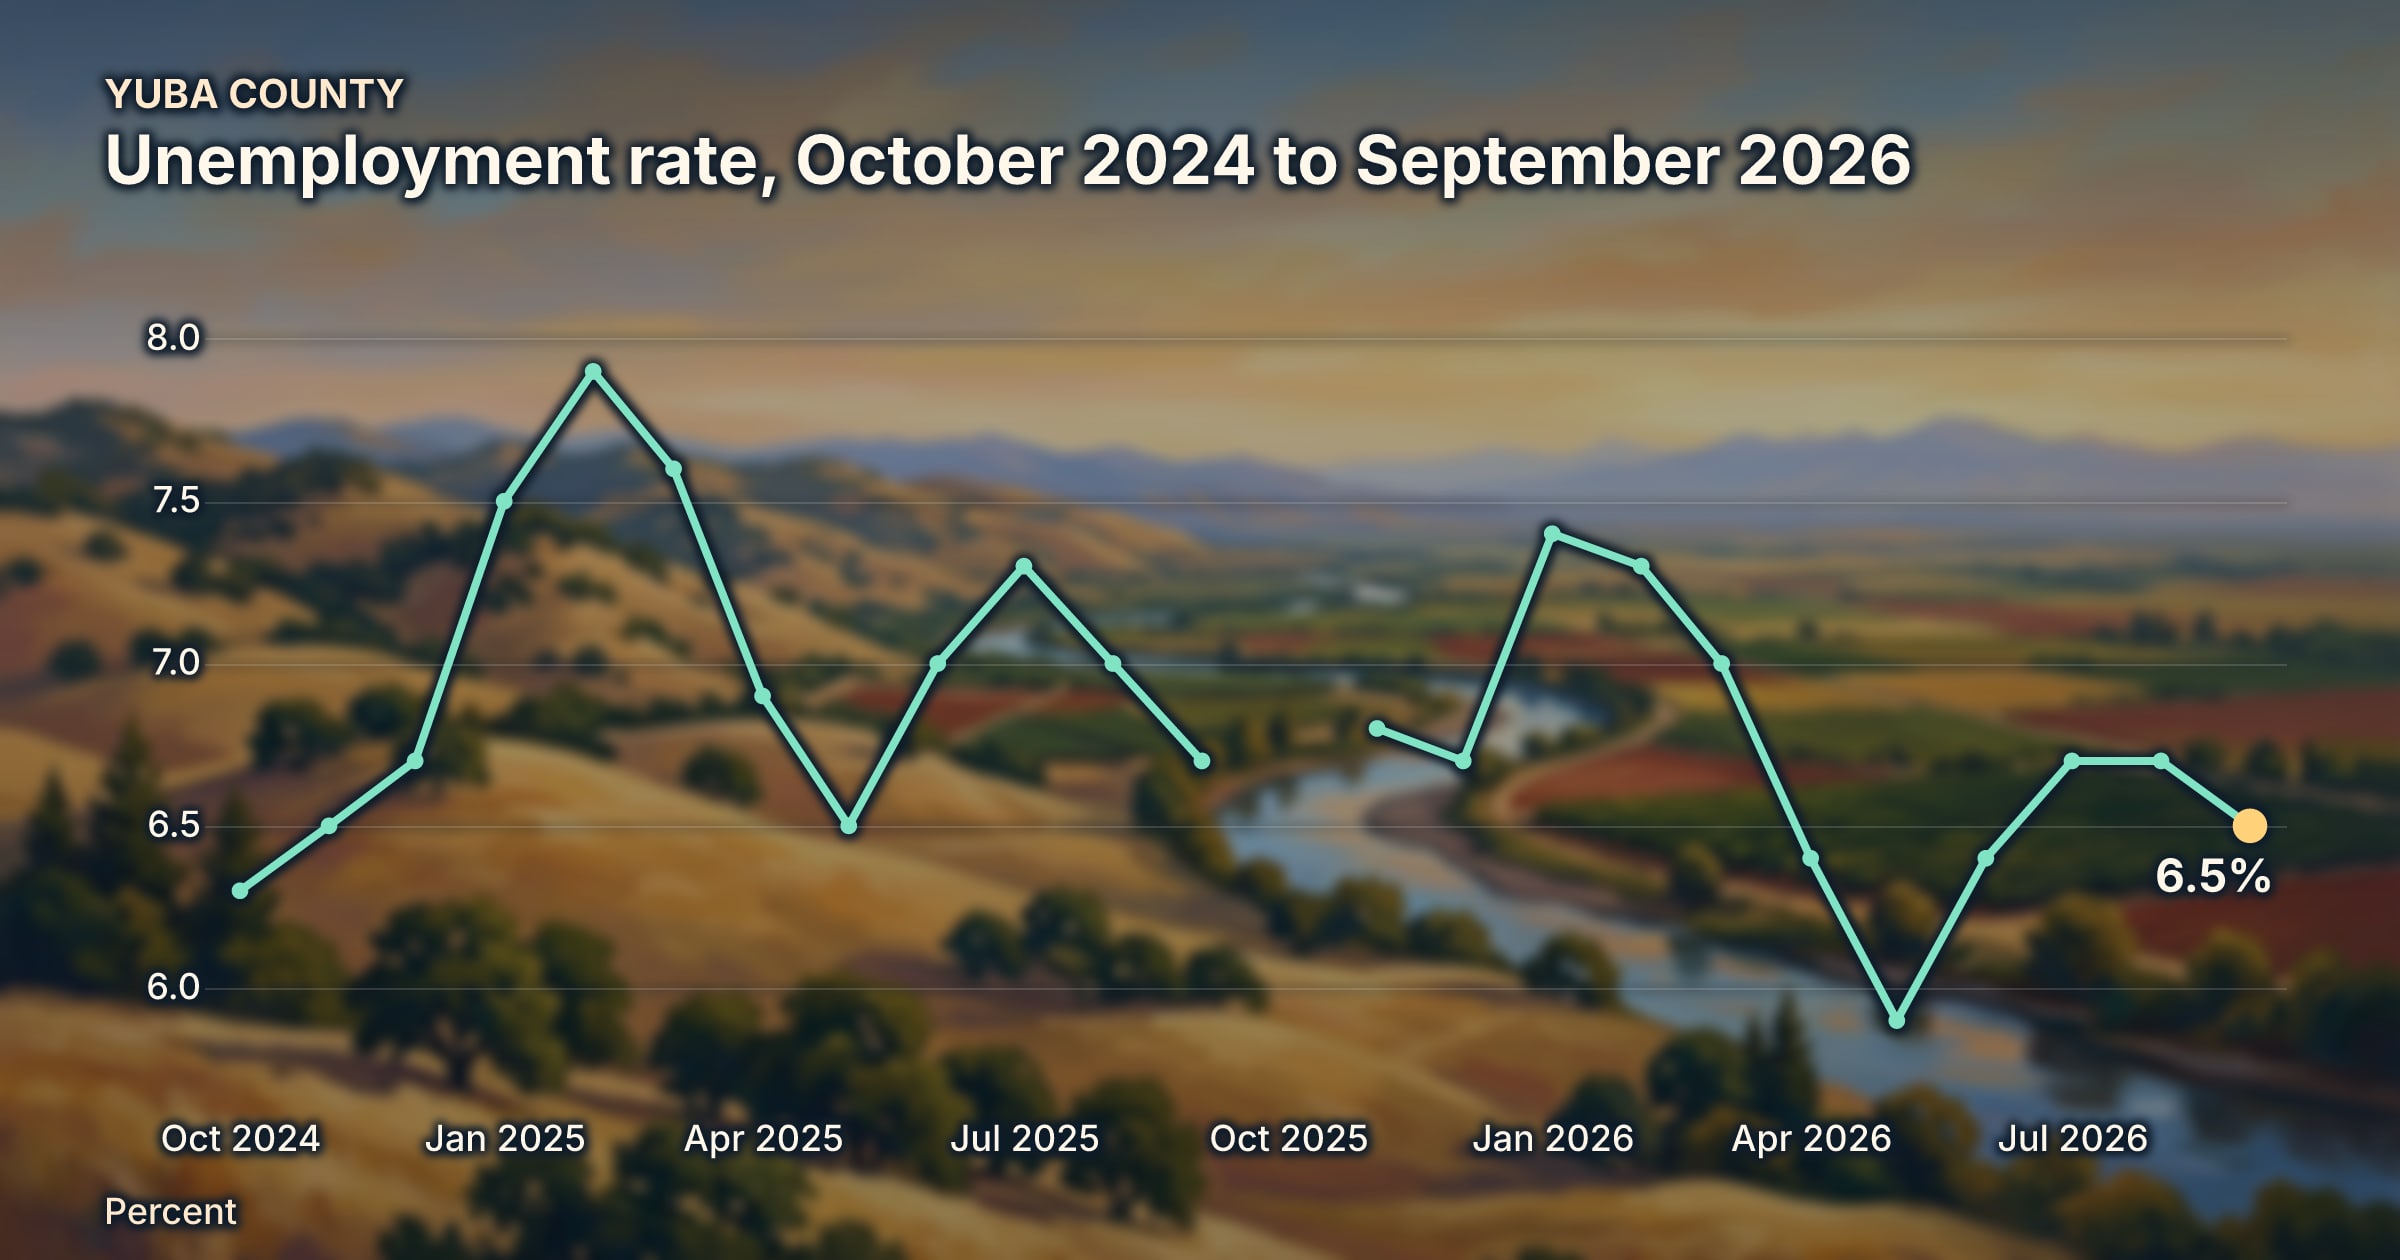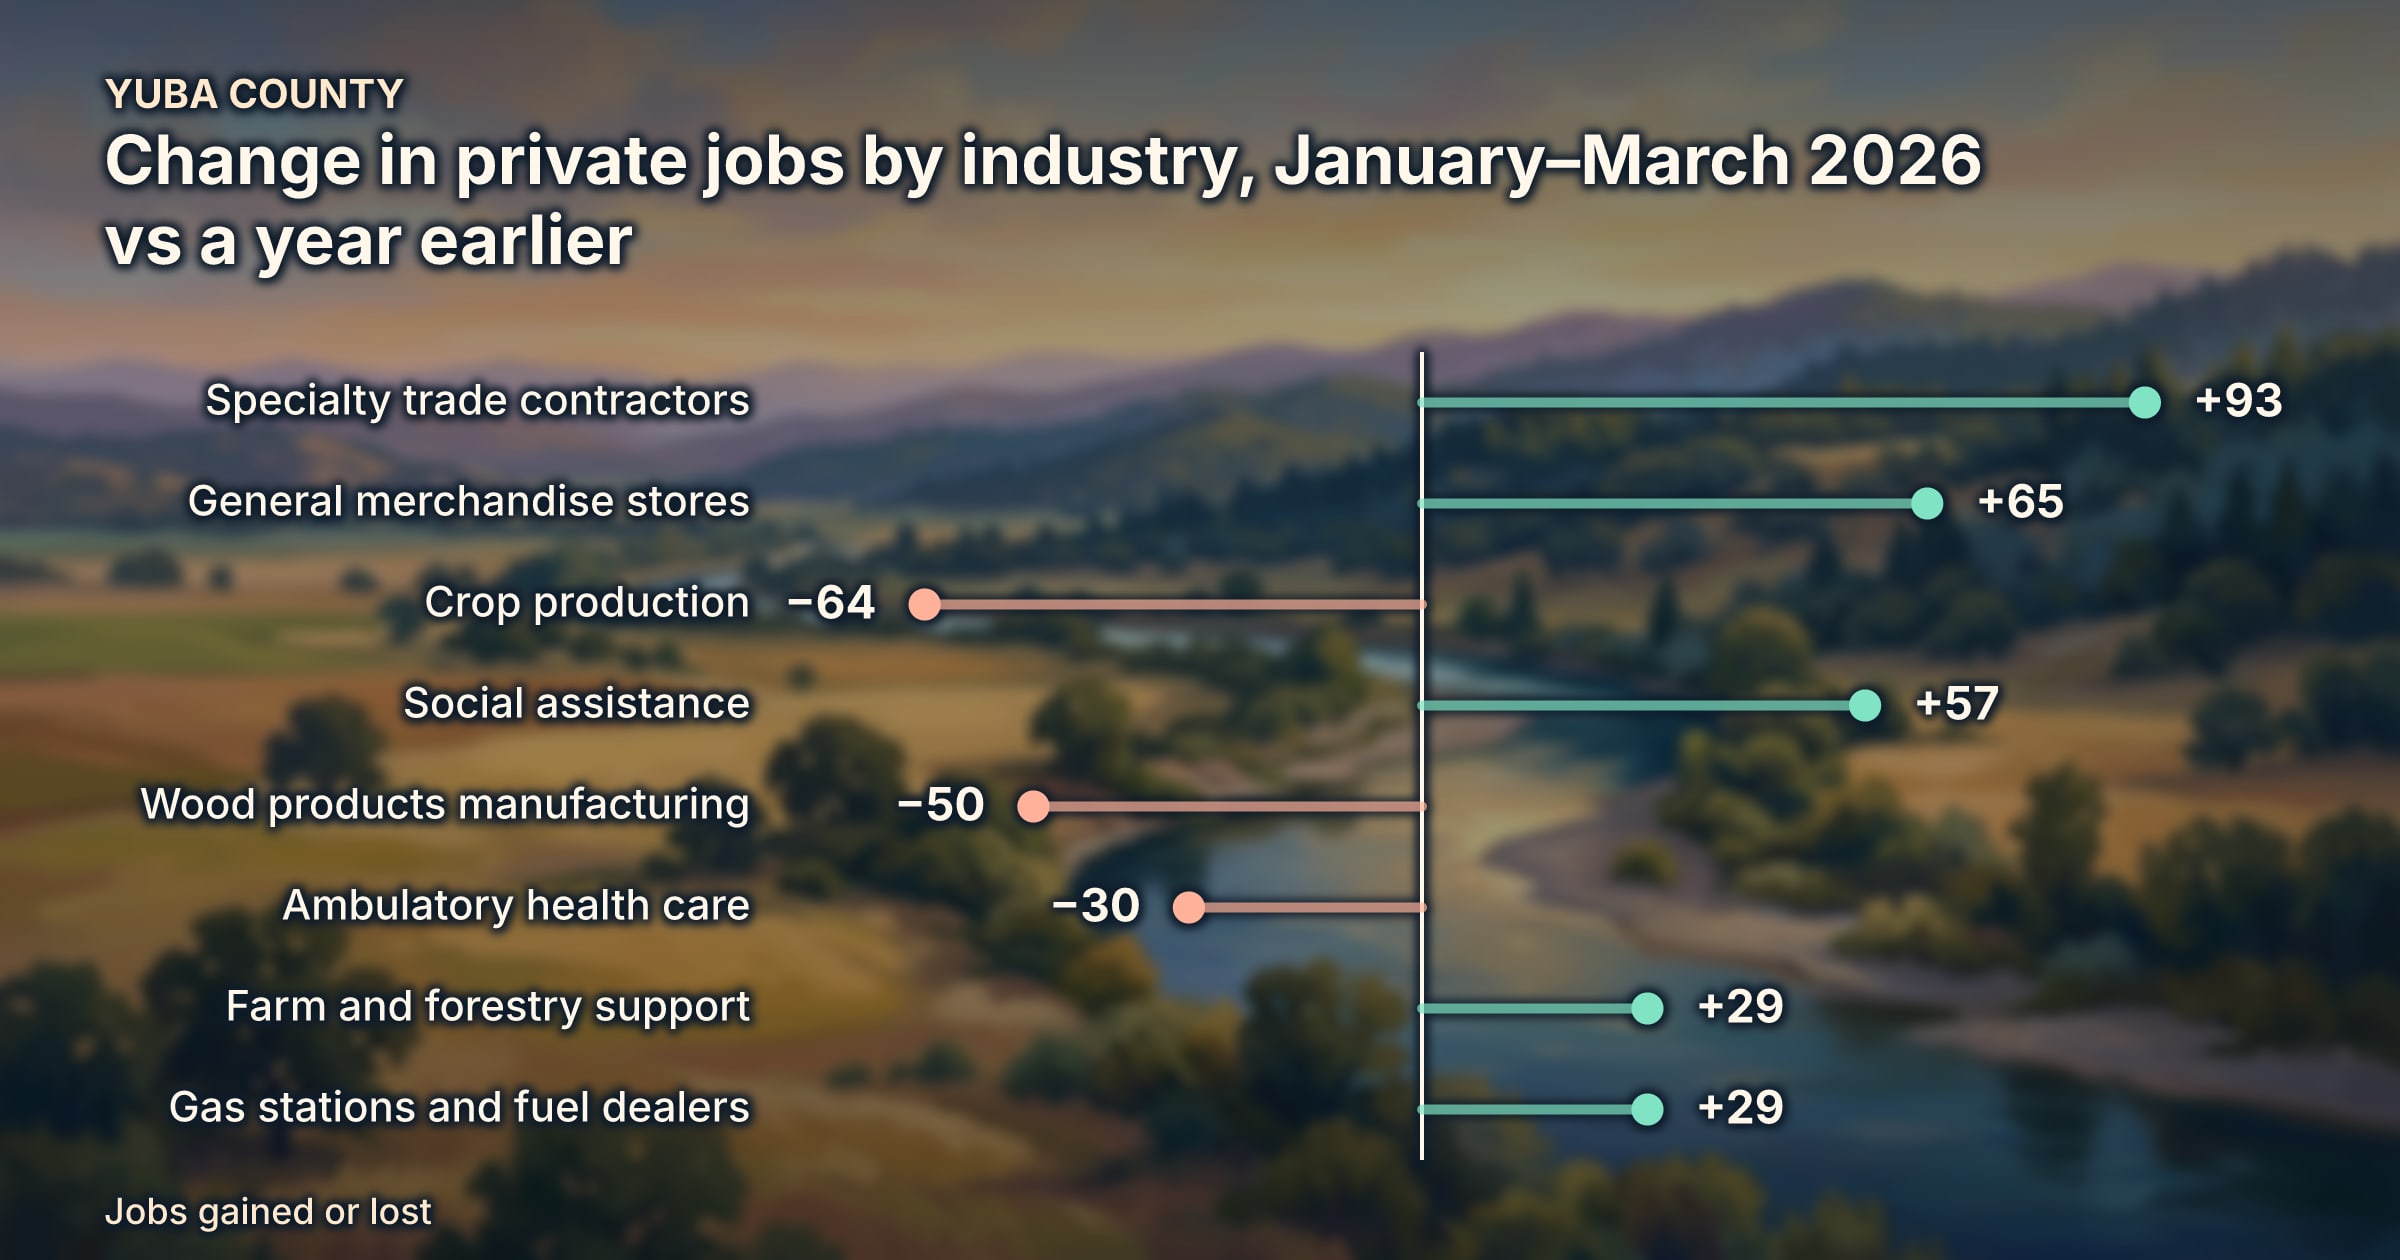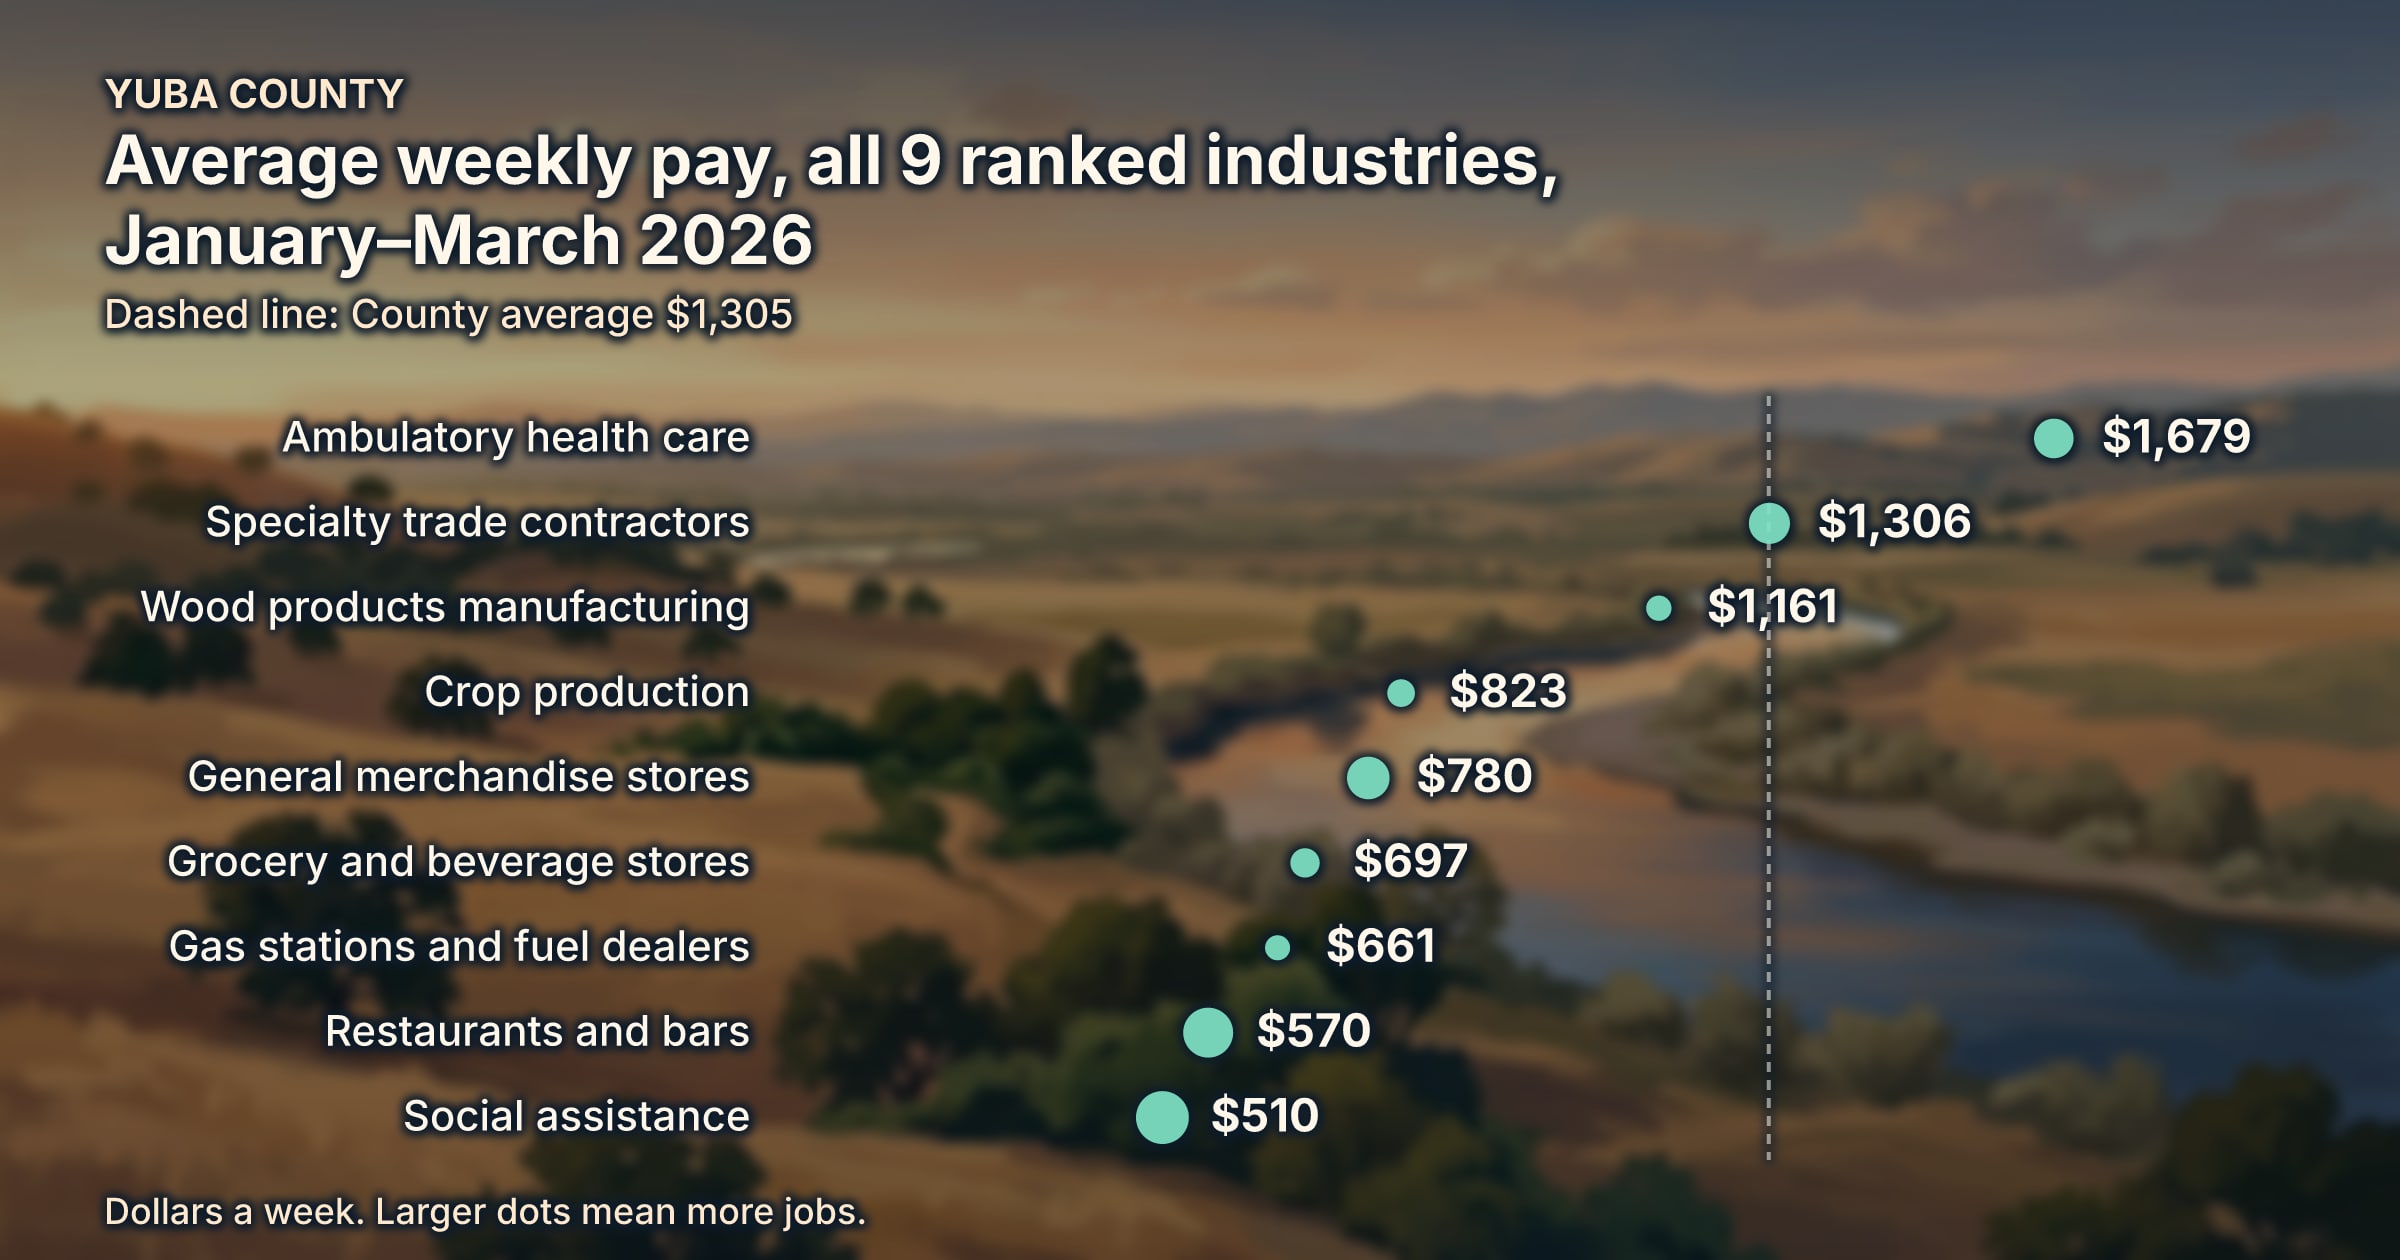
This is Sidekick's data series, which covers the raw numbers behind life in Yuba County: jobs, pay, sales and housing. Each article is built from official public statistics. We report what the numbers show without editorializing: just the numbers, as the agencies report them.
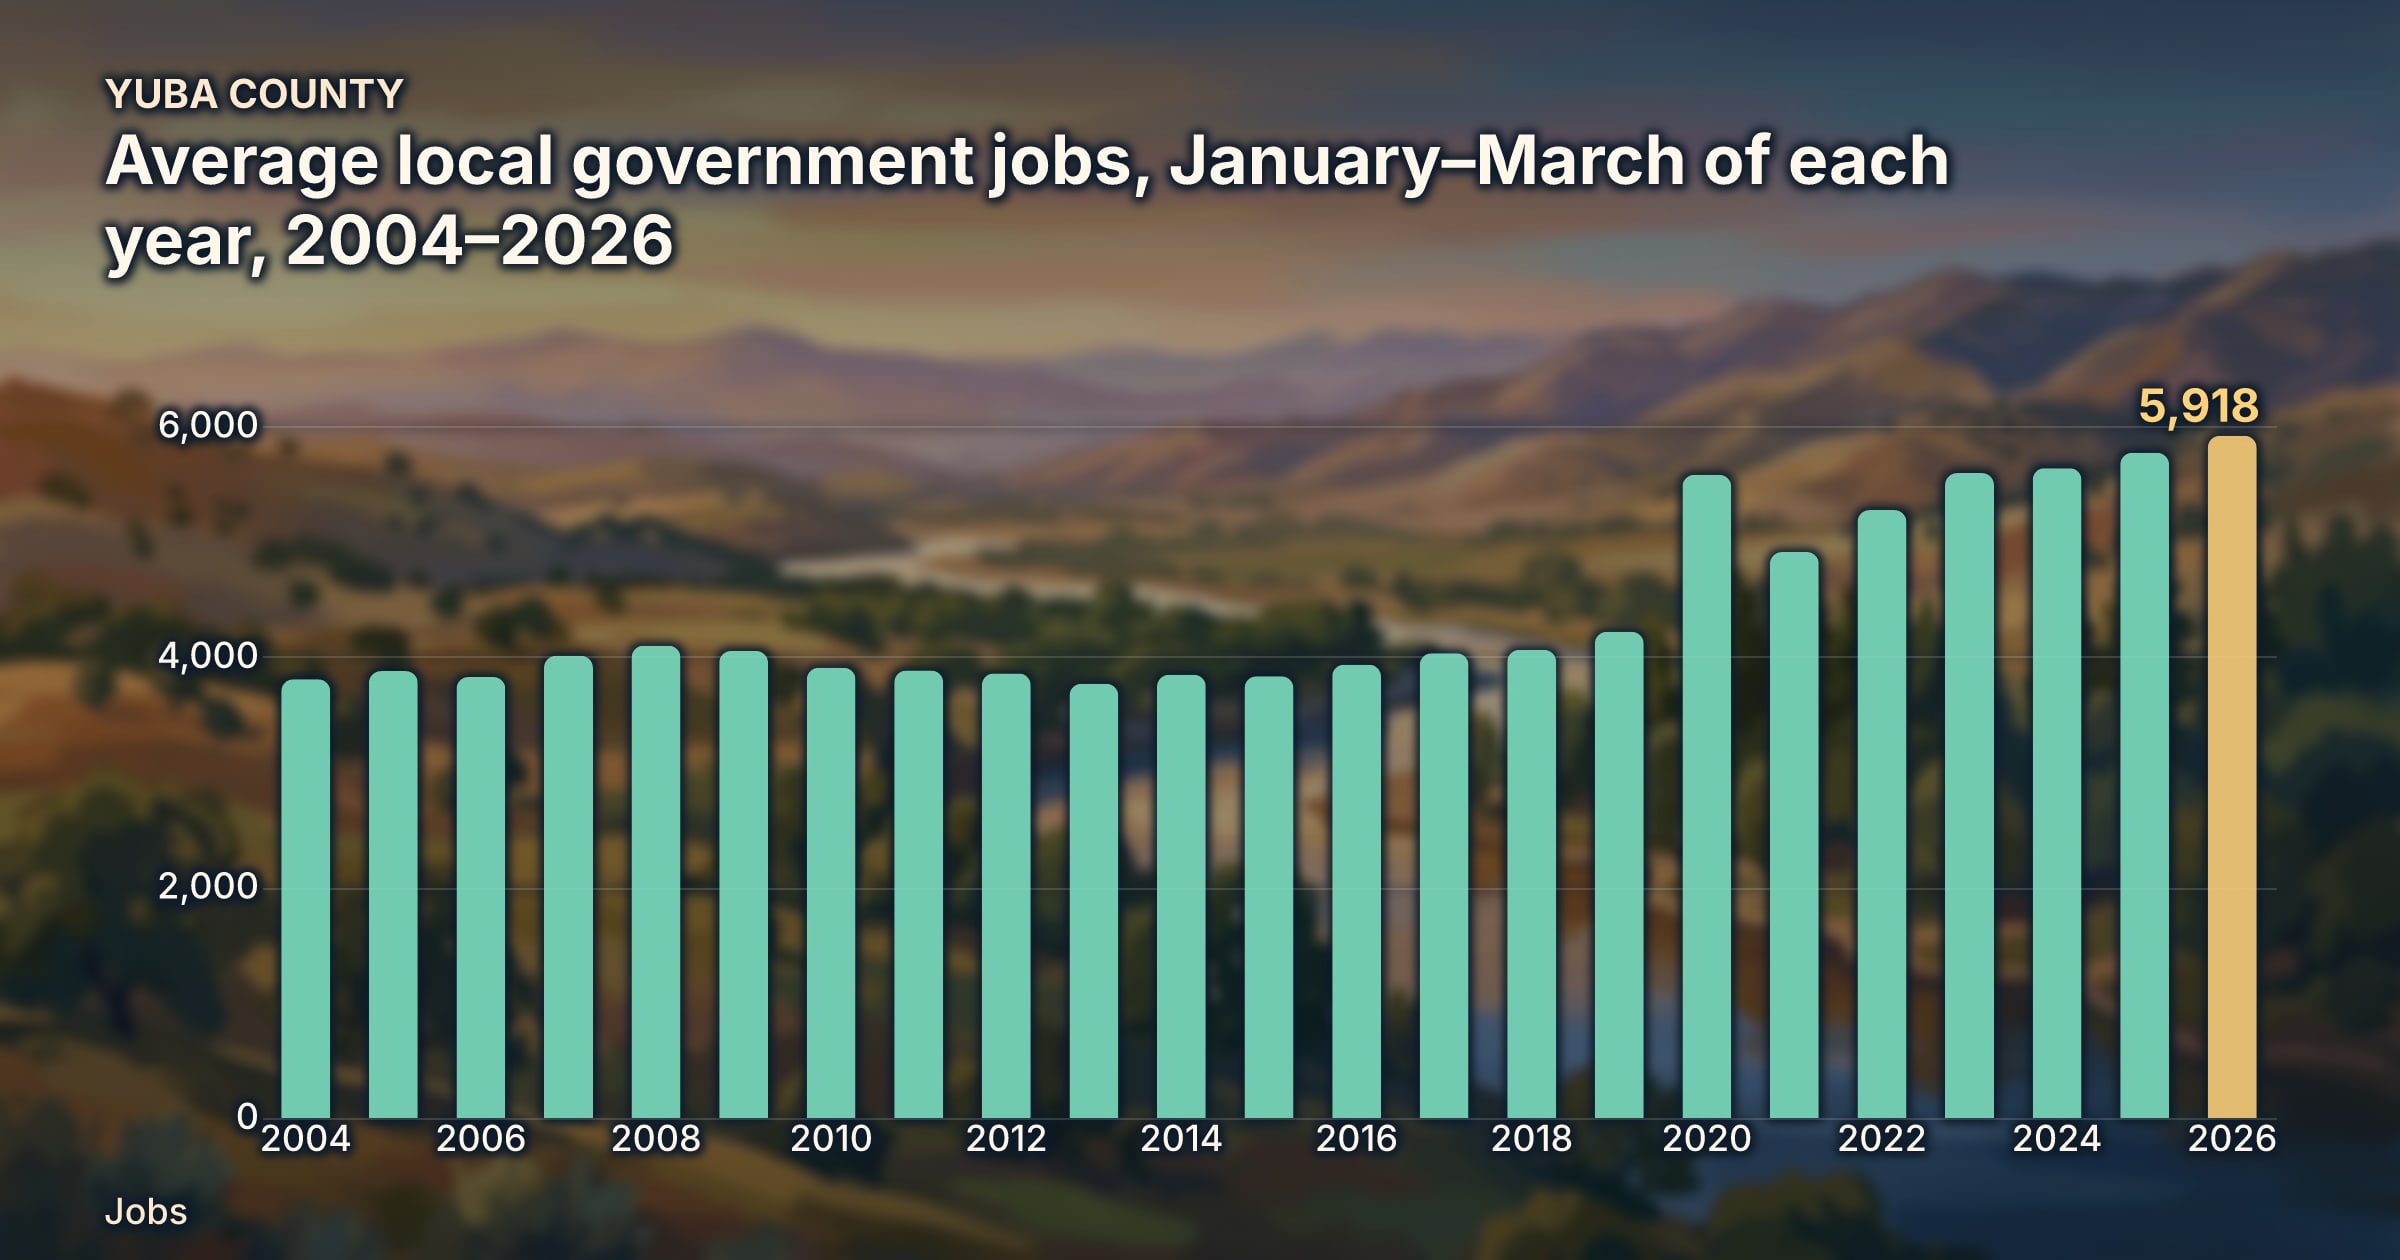
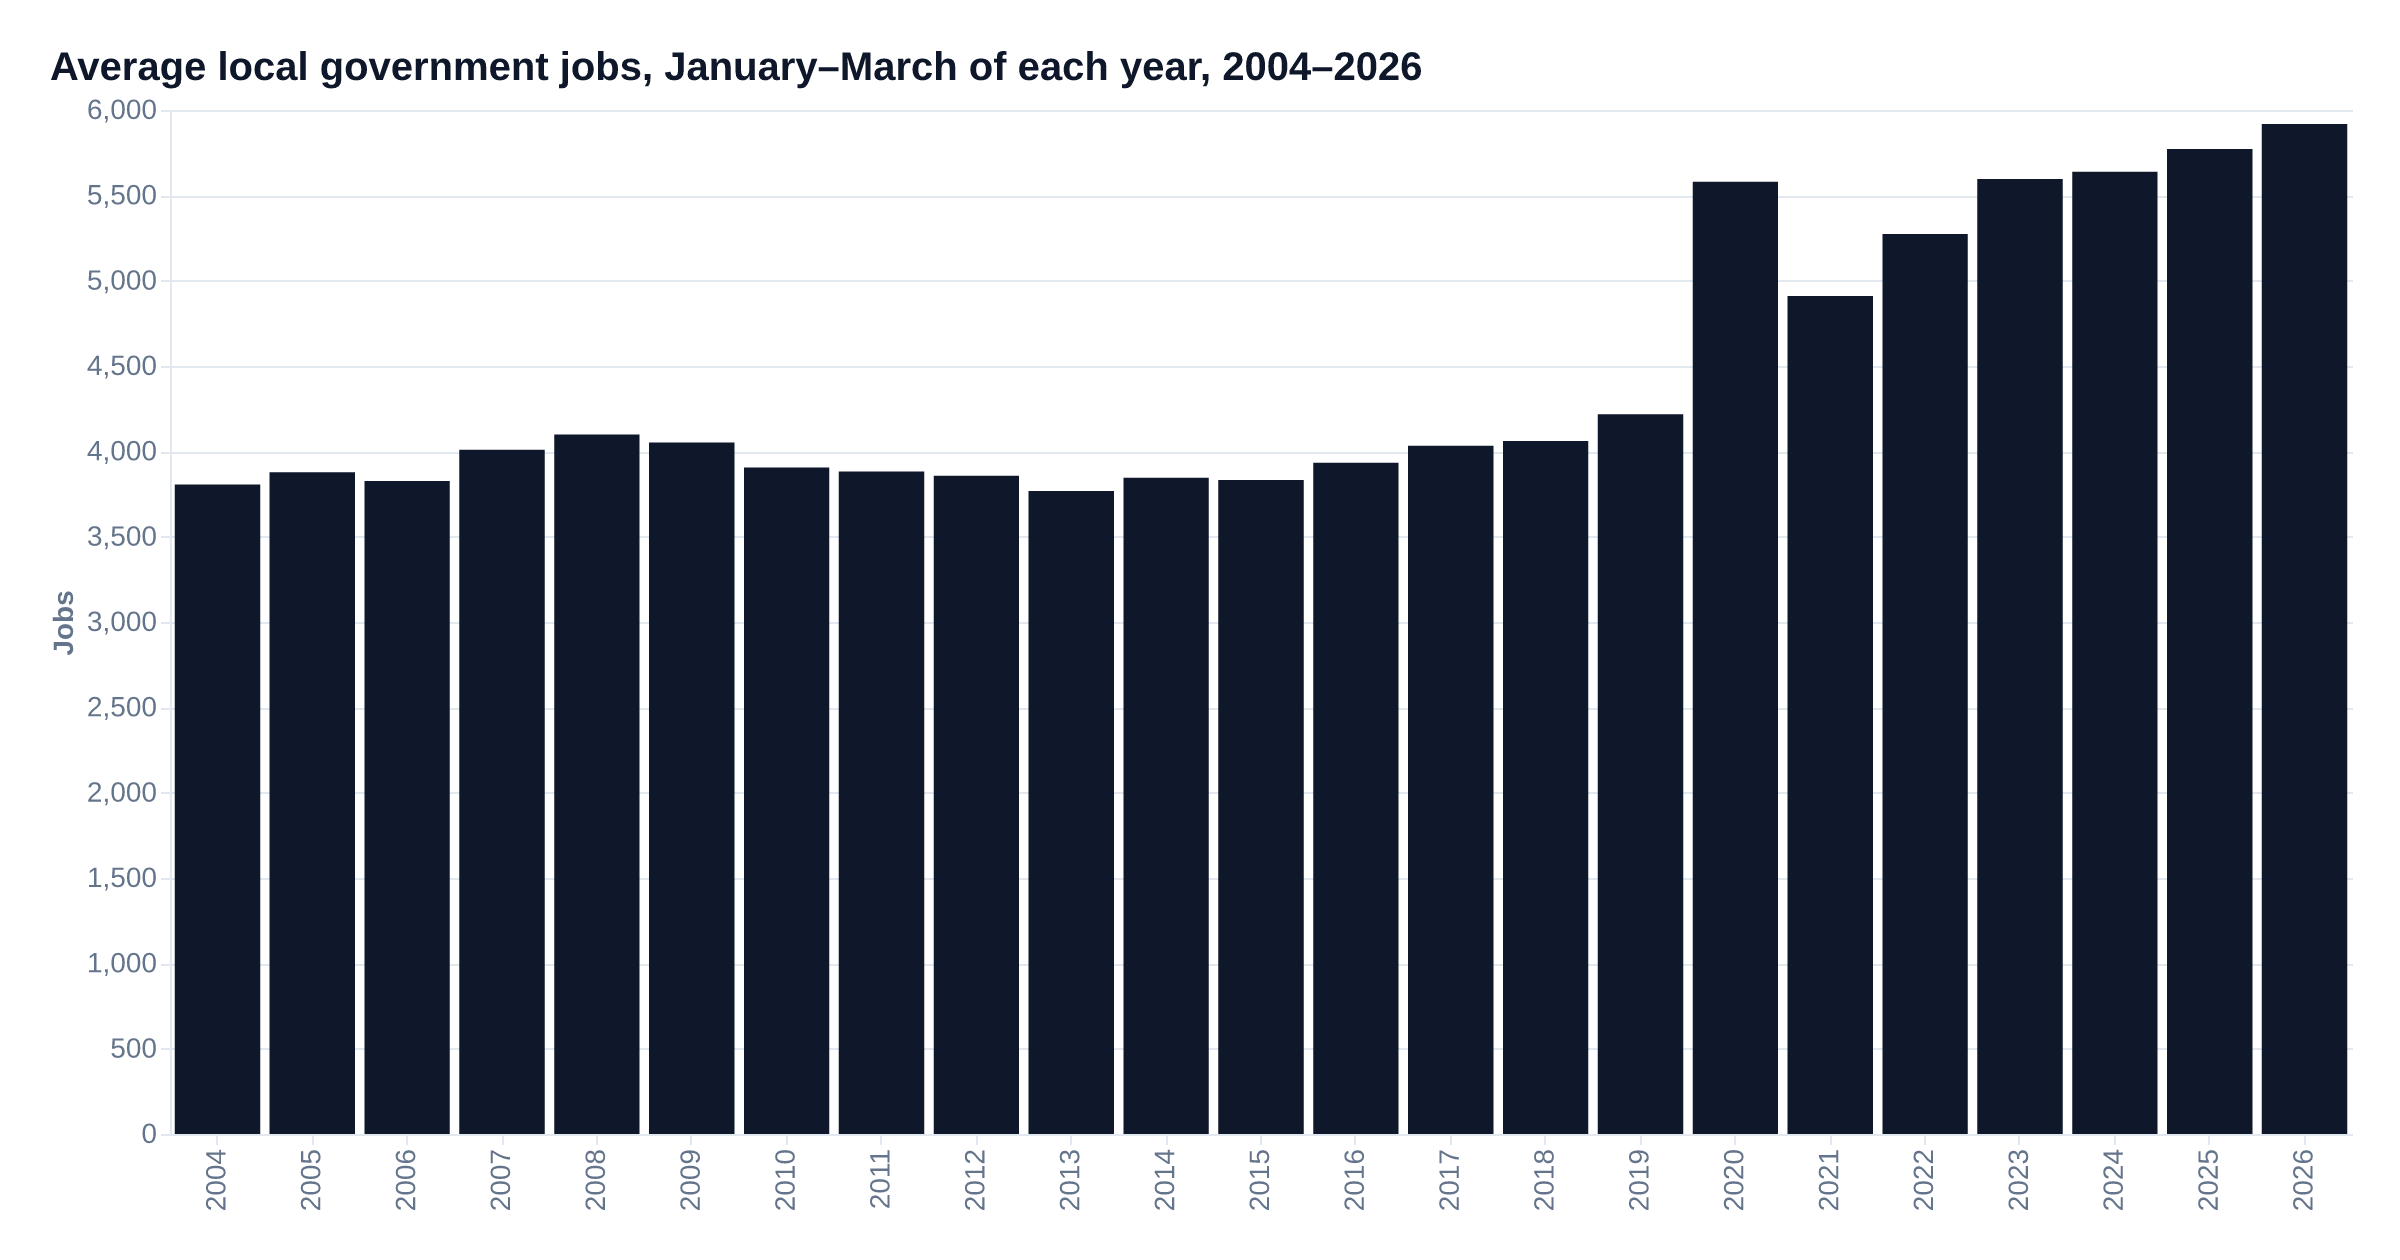
Average local government jobs in Yuba County came to 5,918 in January–March 2026, +147 (+2.5%) from a year earlier.
In context
Compared with a year earlier, the same figure changed +1.4% for California as a whole and +0.6% nationally. It is the highest first-quarter figure since at least 2004. The first-quarter figure has been above the year before for 5 years in a row.
How we calculated this
Changes compare a period with the same period a year earlier.Show the formula
change = value(this period) − value(same period last year); % change = change ÷ value(same period last year) × 100
County figures are shown next to California and the United States for the same period, where the source publishes them.Show the formula
the same measure for California and the United States in the same period; where a change is shown for them, the same change formula
Records and percentiles compare a value with every value for the same month or quarter, up to and including this one.Show the formula
percentile = share of same-month (or same-quarter) values up to and including this one that are at or below it × 100
A streak counts consecutive years of change in the same direction, comparing the same quarter or month each year. In an industry ranking, the industry must also meet the ranking's size floor in every year of the streak.Show the formula
streak = number of consecutive years, ending this year, whose change from the year before has the same sign (no change ends a streak); in rankings, jobs must meet the ranking's size floor in every year of it, the base year included.
Jobs and business-location counts below 200 are not written up; numbers that small swing a lot from year to year.Show the formula
Smallest count written up = 200
A change of less than 0.5% either way from a year earlier is reported as little changed.Show the formula
Little changed = 0.5
Records and percentiles need at least 10 earlier same-season values.Show the formula
History needed = 10
A run of 3 or more years moving the same way, compared quarter to same quarter, is called out.Show the formula
Streaks called out = 3
These figures come from employers' reports to the state's unemployment insurance program, which leave out the self-employed, most religious organizations and uniformed military. County totals include employers whose own figures the state keeps confidential.
Government jobs are counted where the work is; public schools and community colleges are local government, the University of California and CSU are state government.
Local government includes tribal governments and the businesses they run, such as casinos, so hiring at a tribal casino counts here.
Source: California EDD, Quarterly Census of Employment and Wages, data released 2026-10-01.